Compare commits
11 Commits
| Author | SHA1 | Date | |
|---|---|---|---|
|
|
62b1e2c499 | ||
|
|
8b34cb3bd7 | ||
|
|
10950a3bf2 | ||
|
|
d9b5269579 | ||
|
|
412b25feb4 | ||
|
|
68cc6a95d3 | ||
|
|
046daf94fb | ||
|
|
2c9a9218e5 | ||
|
|
feef494764 | ||
|
|
fb0040390c | ||
|
|
9c65a94050 |
18
.gitignore
vendored
|
|
@ -1,19 +1 @@
|
||||||
# Binaries for programs and plugins
|
|
||||||
*.exe
|
|
||||||
*.dll
|
|
||||||
*.so
|
|
||||||
*.dylib
|
|
||||||
|
|
||||||
# Test binary, build with `go test -c`
|
|
||||||
*.test
|
|
||||||
|
|
||||||
# Output of the go coverage tool, specifically when used with LiteIDE
|
|
||||||
*.out
|
|
||||||
|
|
||||||
# Project-local glide cache, RE: https://github.com/Masterminds/glide/issues/736
|
|
||||||
.glide/
|
|
||||||
|
|
||||||
# Other
|
|
||||||
.vscode
|
.vscode
|
||||||
.DS_Store
|
|
||||||
coverage.html
|
|
||||||
13
.travis.yml
Normal file
|
|
@ -0,0 +1,13 @@
|
||||||
|
language: go
|
||||||
|
|
||||||
|
go:
|
||||||
|
- 1.6.2
|
||||||
|
|
||||||
|
sudo: false
|
||||||
|
|
||||||
|
before_script:
|
||||||
|
- go get -u github.com/blendlabs/go-assert
|
||||||
|
- go get ./...
|
||||||
|
|
||||||
|
script:
|
||||||
|
- go test ./...
|
||||||
9
Makefile
Normal file
|
|
@ -0,0 +1,9 @@
|
||||||
|
all: test
|
||||||
|
|
||||||
|
test:
|
||||||
|
@go test ./...
|
||||||
|
|
||||||
|
cover:
|
||||||
|
@go test -short -covermode=set -coverprofile=profile.cov
|
||||||
|
@go tool cover -html=profile.cov
|
||||||
|
@rm profile.cov
|
||||||
99
README.md
Normal file
|
|
@ -0,0 +1,99 @@
|
||||||
|
go-chart
|
||||||
|
========
|
||||||
|
[](https://travis-ci.org/wcharczuk/go-chart)[](https://goreportcard.com/report/github.com/wcharczuk/go-chart)
|
||||||
|
|
||||||
|
Package `chart` is a very simple golang native charting library that supports timeseries and continuous
|
||||||
|
line charts.
|
||||||
|
|
||||||
|
The v1.0 release has been tagged so things should be more or less stable, if something changes please log an issue.
|
||||||
|
|
||||||
|
Master should now be on the v2.x codebase, which brings a couple new features and better handling of basics like axes labeling etc. Per usual, see `_examples` for more information.
|
||||||
|
|
||||||
|
# Installation
|
||||||
|
|
||||||
|
To install `chart` run the following:
|
||||||
|
|
||||||
|
```bash
|
||||||
|
> go get -u github.com/wcharczuk/go-chart
|
||||||
|
```
|
||||||
|
|
||||||
|
Most of the components are interchangeable so feel free to crib whatever you want.
|
||||||
|
|
||||||
|
# Output Examples
|
||||||
|
|
||||||
|
Spark Lines:
|
||||||
|
|
||||||
|

|
||||||
|
|
||||||
|
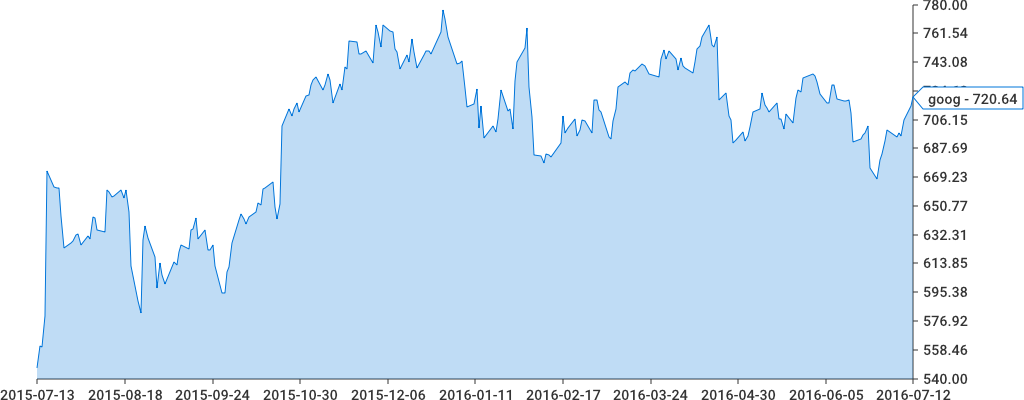
Single axis:
|
||||||
|
|
||||||
|
|
||||||
|
|
||||||
|
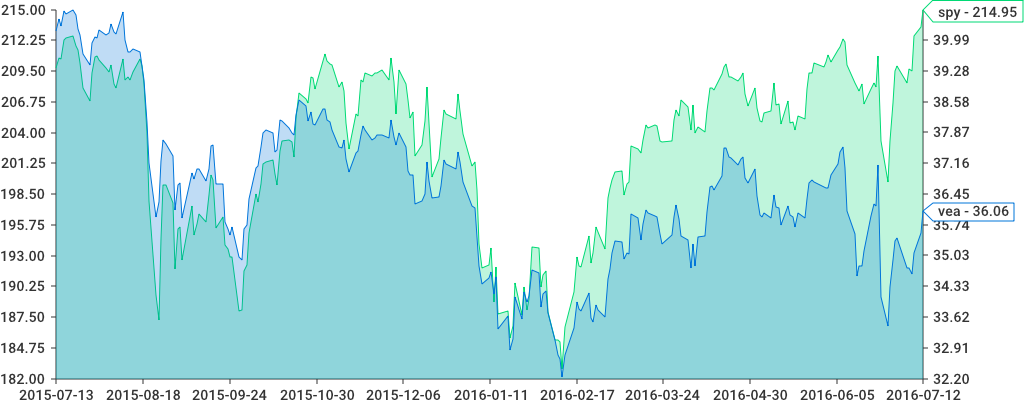
Two axis:
|
||||||
|
|
||||||
|
|
||||||
|
|
||||||
|
# Other Chart Types
|
||||||
|
|
||||||
|
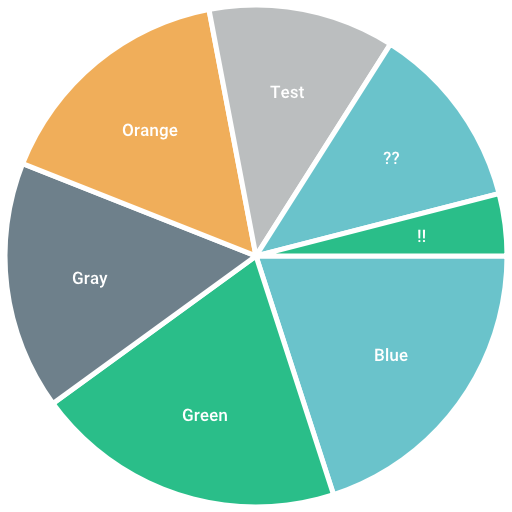
Pie Chart:
|
||||||
|
|
||||||
|
|
||||||
|
|
||||||
|
The code for this chart can be found in `_examples/pie_chart/main.go`.
|
||||||
|
|
||||||
|
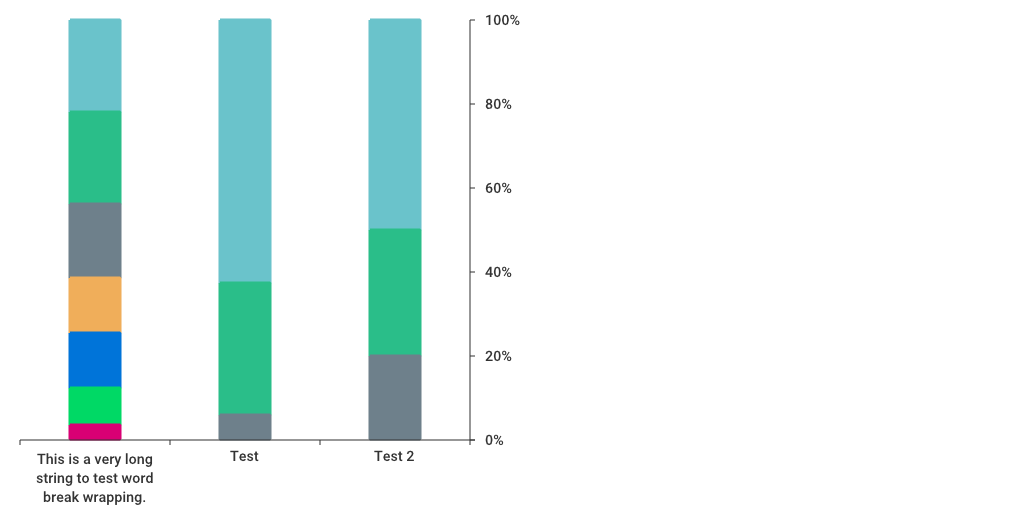
Stacked Bar:
|
||||||
|
|
||||||
|
|
||||||
|
|
||||||
|
The code for this chart can be found in `_examples/stacked_bar/main.go`.
|
||||||
|
|
||||||
|
# Code Examples
|
||||||
|
|
||||||
|
Actual chart configurations and examples can be found in the `./_examples/` directory. They are web servers, so start them with `go run main.go` then access `http://localhost:8080` to see the output.
|
||||||
|
|
||||||
|
# Usage
|
||||||
|
|
||||||
|
Everything starts with the `chart.Chart` object. The bare minimum to draw a chart would be the following:
|
||||||
|
|
||||||
|
```golang
|
||||||
|
|
||||||
|
import (
|
||||||
|
...
|
||||||
|
"bytes"
|
||||||
|
...
|
||||||
|
"github.com/wcharczuk/go-chart" //exposes "chart"
|
||||||
|
)
|
||||||
|
|
||||||
|
graph := chart.Chart{
|
||||||
|
Series: []chart.Series{
|
||||||
|
chart.ContinuousSeries{
|
||||||
|
XValues: []float64{1.0, 2.0, 3.0, 4.0},
|
||||||
|
YValues: []float64{1.0, 2.0, 3.0, 4.0},
|
||||||
|
},
|
||||||
|
},
|
||||||
|
}
|
||||||
|
|
||||||
|
buffer := bytes.NewBuffer([]byte{})
|
||||||
|
err := graph.Render(chart.PNG, buffer)
|
||||||
|
```
|
||||||
|
|
||||||
|
Explanation of the above: A `chart` can have many `Series`, a `Series` is a collection of things that need to be drawn according to the X range and the Y range(s).
|
||||||
|
|
||||||
|
Here, we have a single series with x range values as float64s, rendered to a PNG. Note; we can pass any type of `io.Writer` into `Render(...)`, meaning that we can render the chart to a file or a resonse or anything else that implements `io.Writer`.
|
||||||
|
|
||||||
|
# API Overview
|
||||||
|
|
||||||
|
Everything on the `chart.Chart` object has defaults that can be overriden. Whenever a developer sets a property on the chart object, it is to be assumed that value will be used instead of the default. One complication here
|
||||||
|
is any object's root `chart.Style` object (i.e named `Style`) and the `Show` property specifically, if any other property is set and the `Show` property is unset, it is assumed to be it's default value of `False`.
|
||||||
|
|
||||||
|
The best way to see the api in action is to look at the examples in the `./_examples/` directory.
|
||||||
|
|
||||||
|
# Design Philosophy
|
||||||
|
|
||||||
|
I wanted to make a charting library that used only native golang, that could be stood up on a server (i.e. it had built in fonts).
|
||||||
|
|
||||||
|
The goal with the API itself is to have the "zero value be useful", and to require the user to not code more than they absolutely needed.
|
||||||
|
|
||||||
|
# Contributions
|
||||||
|
|
||||||
|
This library is super early but contributions are welcome.
|
||||||
|
|
@ -3,7 +3,7 @@ package main
|
||||||
import (
|
import (
|
||||||
"net/http"
|
"net/http"
|
||||||
|
|
||||||
"git.fireandbrimst.one/aw/go-chart"
|
"github.com/wcharczuk/go-chart"
|
||||||
)
|
)
|
||||||
|
|
||||||
func drawChart(res http.ResponseWriter, req *http.Request) {
|
func drawChart(res http.ResponseWriter, req *http.Request) {
|
||||||
|
|
|
||||||
|
Before Width: | Height: | Size: 14 KiB After Width: | Height: | Size: 14 KiB |
|
|
@ -3,7 +3,7 @@ package main
|
||||||
import (
|
import (
|
||||||
"net/http"
|
"net/http"
|
||||||
|
|
||||||
"git.fireandbrimst.one/aw/go-chart"
|
"github.com/wcharczuk/go-chart"
|
||||||
)
|
)
|
||||||
|
|
||||||
func drawChart(res http.ResponseWriter, req *http.Request) {
|
func drawChart(res http.ResponseWriter, req *http.Request) {
|
||||||
|
|
@ -15,10 +15,14 @@ func drawChart(res http.ResponseWriter, req *http.Request) {
|
||||||
|
|
||||||
graph := chart.Chart{
|
graph := chart.Chart{
|
||||||
XAxis: chart.XAxis{
|
XAxis: chart.XAxis{
|
||||||
Style: chart.StyleShow(), //enables / displays the x-axis
|
Style: chart.Style{
|
||||||
|
Show: true, //enables / displays the x-axis
|
||||||
|
},
|
||||||
},
|
},
|
||||||
YAxis: chart.YAxis{
|
YAxis: chart.YAxis{
|
||||||
Style: chart.StyleShow(), //enables / displays the y-axis
|
Style: chart.Style{
|
||||||
|
Show: true, //enables / displays the y-axis
|
||||||
|
},
|
||||||
},
|
},
|
||||||
Series: []chart.Series{
|
Series: []chart.Series{
|
||||||
chart.ContinuousSeries{
|
chart.ContinuousSeries{
|
||||||
|
|
|
||||||
|
Before Width: | Height: | Size: 22 KiB After Width: | Height: | Size: 21 KiB |
|
|
@ -3,7 +3,7 @@ package main
|
||||||
import (
|
import (
|
||||||
"net/http"
|
"net/http"
|
||||||
|
|
||||||
"git.fireandbrimst.one/aw/go-chart"
|
"github.com/wcharczuk/go-chart"
|
||||||
)
|
)
|
||||||
|
|
||||||
func drawChart(res http.ResponseWriter, req *http.Request) {
|
func drawChart(res http.ResponseWriter, req *http.Request) {
|
||||||
|
|
|
||||||
|
Before Width: | Height: | Size: 24 KiB After Width: | Height: | Size: 23 KiB |
|
|
@ -6,23 +6,20 @@ import (
|
||||||
"net/http"
|
"net/http"
|
||||||
"os"
|
"os"
|
||||||
|
|
||||||
"git.fireandbrimst.one/aw/go-chart"
|
"github.com/wcharczuk/go-chart"
|
||||||
)
|
)
|
||||||
|
|
||||||
func drawChart(res http.ResponseWriter, req *http.Request) {
|
func drawChart(res http.ResponseWriter, req *http.Request) {
|
||||||
sbc := chart.BarChart{
|
sbc := chart.BarChart{
|
||||||
Title: "Test Bar Chart",
|
|
||||||
TitleStyle: chart.StyleShow(),
|
|
||||||
Background: chart.Style{
|
|
||||||
Padding: chart.Box{
|
|
||||||
Top: 40,
|
|
||||||
},
|
|
||||||
},
|
|
||||||
Height: 512,
|
Height: 512,
|
||||||
BarWidth: 60,
|
BarWidth: 60,
|
||||||
XAxis: chart.StyleShow(),
|
XAxis: chart.Style{
|
||||||
|
Show: true,
|
||||||
|
},
|
||||||
YAxis: chart.YAxis{
|
YAxis: chart.YAxis{
|
||||||
Style: chart.StyleShow(),
|
Style: chart.Style{
|
||||||
|
Show: true,
|
||||||
|
},
|
||||||
},
|
},
|
||||||
Bars: []chart.Value{
|
Bars: []chart.Value{
|
||||||
{Value: 5.25, Label: "Blue"},
|
{Value: 5.25, Label: "Blue"},
|
||||||
|
|
|
||||||
|
Before Width: | Height: | Size: 19 KiB After Width: | Height: | Size: 16 KiB |
|
|
@ -1,88 +0,0 @@
|
||||||
package main
|
|
||||||
|
|
||||||
import (
|
|
||||||
"fmt"
|
|
||||||
"log"
|
|
||||||
"net/http"
|
|
||||||
"os"
|
|
||||||
|
|
||||||
"git.fireandbrimst.one/aw/go-chart"
|
|
||||||
"git.fireandbrimst.one/aw/go-chart/drawing"
|
|
||||||
)
|
|
||||||
|
|
||||||
func drawChart(res http.ResponseWriter, req *http.Request) {
|
|
||||||
profitStyle := chart.Style{
|
|
||||||
Show: true,
|
|
||||||
FillColor: drawing.ColorFromHex("13c158"),
|
|
||||||
StrokeColor: drawing.ColorFromHex("13c158"),
|
|
||||||
StrokeWidth: 0,
|
|
||||||
}
|
|
||||||
|
|
||||||
lossStyle := chart.Style{
|
|
||||||
Show: true,
|
|
||||||
FillColor: drawing.ColorFromHex("c11313"),
|
|
||||||
StrokeColor: drawing.ColorFromHex("c11313"),
|
|
||||||
StrokeWidth: 0,
|
|
||||||
}
|
|
||||||
|
|
||||||
sbc := chart.BarChart{
|
|
||||||
Title: "Bar Chart Using BaseValue",
|
|
||||||
TitleStyle: chart.StyleShow(),
|
|
||||||
Background: chart.Style{
|
|
||||||
Padding: chart.Box{
|
|
||||||
Top: 40,
|
|
||||||
},
|
|
||||||
},
|
|
||||||
Height: 512,
|
|
||||||
BarWidth: 60,
|
|
||||||
XAxis: chart.Style{
|
|
||||||
Show: true,
|
|
||||||
},
|
|
||||||
YAxis: chart.YAxis{
|
|
||||||
Style: chart.Style{
|
|
||||||
Show: true,
|
|
||||||
},
|
|
||||||
Ticks: []chart.Tick{
|
|
||||||
{-4.0, "-4"},
|
|
||||||
{-2.0, "-2"},
|
|
||||||
{0, "0"},
|
|
||||||
{2.0, "2"},
|
|
||||||
{4.0, "4"},
|
|
||||||
{6.0, "6"},
|
|
||||||
{8.0, "8"},
|
|
||||||
{10.0, "10"},
|
|
||||||
{12.0, "12"},
|
|
||||||
},
|
|
||||||
},
|
|
||||||
UseBaseValue: true,
|
|
||||||
BaseValue: 0.0,
|
|
||||||
Bars: []chart.Value{
|
|
||||||
{Value: 10.0, Style: profitStyle, Label: "Profit"},
|
|
||||||
{Value: 12.0, Style: profitStyle, Label: "More Profit"},
|
|
||||||
{Value: 8.0, Style: profitStyle, Label: "Still Profit"},
|
|
||||||
{Value: -4.0, Style: lossStyle, Label: "Loss!"},
|
|
||||||
{Value: 3.0, Style: profitStyle, Label: "Phew Ok"},
|
|
||||||
{Value: -2.0, Style: lossStyle, Label: "Oh No!"},
|
|
||||||
},
|
|
||||||
}
|
|
||||||
|
|
||||||
res.Header().Set("Content-Type", "image/png")
|
|
||||||
err := sbc.Render(chart.PNG, res)
|
|
||||||
if err != nil {
|
|
||||||
fmt.Printf("Error rendering chart: %v\n", err)
|
|
||||||
}
|
|
||||||
}
|
|
||||||
|
|
||||||
func port() string {
|
|
||||||
if len(os.Getenv("PORT")) > 0 {
|
|
||||||
return os.Getenv("PORT")
|
|
||||||
}
|
|
||||||
return "8080"
|
|
||||||
}
|
|
||||||
|
|
||||||
func main() {
|
|
||||||
listenPort := fmt.Sprintf(":%s", port())
|
|
||||||
fmt.Printf("Listening on %s\n", listenPort)
|
|
||||||
http.HandleFunc("/", drawChart)
|
|
||||||
log.Fatal(http.ListenAndServe(listenPort, nil))
|
|
||||||
}
|
|
||||||
|
Before Width: | Height: | Size: 18 KiB |
|
|
@ -4,7 +4,7 @@ import (
|
||||||
"log"
|
"log"
|
||||||
"net/http"
|
"net/http"
|
||||||
|
|
||||||
"git.fireandbrimst.one/aw/go-chart"
|
"github.com/wcharczuk/go-chart"
|
||||||
)
|
)
|
||||||
|
|
||||||
func drawChart(res http.ResponseWriter, req *http.Request) {
|
func drawChart(res http.ResponseWriter, req *http.Request) {
|
||||||
|
|
@ -26,8 +26,8 @@ func drawChartWide(res http.ResponseWriter, req *http.Request) {
|
||||||
Width: 1920, //this overrides the default.
|
Width: 1920, //this overrides the default.
|
||||||
Series: []chart.Series{
|
Series: []chart.Series{
|
||||||
chart.ContinuousSeries{
|
chart.ContinuousSeries{
|
||||||
XValues: []float64{1.0, 2.0, 3.0, 4.0},
|
XValues: []float64{1.0, 2.0, 3.0, 4.0, 5.0},
|
||||||
YValues: []float64{1.0, 2.0, 3.0, 4.0},
|
YValues: []float64{1.0, 2.0, 3.0, 4.0, 5.0},
|
||||||
},
|
},
|
||||||
},
|
},
|
||||||
}
|
}
|
||||||
|
|
|
||||||
|
Before Width: | Height: | Size: 11 KiB After Width: | Height: | Size: 12 KiB |
|
|
@ -1,79 +0,0 @@
|
||||||
// Usage: http://localhost:8080?series=100&values=1000
|
|
||||||
package main
|
|
||||||
|
|
||||||
import (
|
|
||||||
"fmt"
|
|
||||||
"math/rand"
|
|
||||||
"net/http"
|
|
||||||
"strconv"
|
|
||||||
"time"
|
|
||||||
|
|
||||||
"git.fireandbrimst.one/aw/go-chart"
|
|
||||||
)
|
|
||||||
|
|
||||||
func random(min, max float64) float64 {
|
|
||||||
return rand.Float64()*(max-min) + min
|
|
||||||
}
|
|
||||||
|
|
||||||
func drawLargeChart(res http.ResponseWriter, r *http.Request) {
|
|
||||||
numSeriesInt64, err := strconv.ParseInt(r.FormValue("series"), 10, 64)
|
|
||||||
if err != nil {
|
|
||||||
numSeriesInt64 = int64(1)
|
|
||||||
}
|
|
||||||
if numSeriesInt64 == 0 {
|
|
||||||
numSeriesInt64 = 1
|
|
||||||
}
|
|
||||||
numSeries := int(numSeriesInt64)
|
|
||||||
|
|
||||||
numValuesInt64, err := strconv.ParseInt(r.FormValue("values"), 10, 64)
|
|
||||||
if err != nil {
|
|
||||||
numValuesInt64 = int64(100)
|
|
||||||
}
|
|
||||||
if numValuesInt64 == 0 {
|
|
||||||
numValuesInt64 = int64(100)
|
|
||||||
}
|
|
||||||
numValues := int(numValuesInt64)
|
|
||||||
|
|
||||||
series := make([]chart.Series, numSeries)
|
|
||||||
|
|
||||||
for i := 0; i < numSeries; i++ {
|
|
||||||
xValues := make([]time.Time, numValues)
|
|
||||||
yValues := make([]float64, numValues)
|
|
||||||
|
|
||||||
for j := 0; j < numValues; j++ {
|
|
||||||
xValues[j] = time.Now().AddDate(0, 0, (numValues-j)*-1)
|
|
||||||
yValues[j] = random(float64(-500), float64(500))
|
|
||||||
}
|
|
||||||
|
|
||||||
series[i] = chart.TimeSeries{
|
|
||||||
Name: fmt.Sprintf("aaa.bbb.hostname-%v.ccc.ddd.eee.fff.ggg.hhh.iii.jjj.kkk.lll.mmm.nnn.value", i),
|
|
||||||
XValues: xValues,
|
|
||||||
YValues: yValues,
|
|
||||||
}
|
|
||||||
}
|
|
||||||
|
|
||||||
graph := chart.Chart{
|
|
||||||
XAxis: chart.XAxis{
|
|
||||||
Name: "Time",
|
|
||||||
NameStyle: chart.StyleShow(),
|
|
||||||
Style: chart.StyleShow(),
|
|
||||||
},
|
|
||||||
YAxis: chart.YAxis{
|
|
||||||
Name: "Value",
|
|
||||||
NameStyle: chart.StyleShow(),
|
|
||||||
Style: chart.StyleShow(),
|
|
||||||
},
|
|
||||||
Series: series,
|
|
||||||
}
|
|
||||||
|
|
||||||
res.Header().Set("Content-Type", "image/png")
|
|
||||||
graph.Render(chart.PNG, res)
|
|
||||||
}
|
|
||||||
|
|
||||||
func main() {
|
|
||||||
http.HandleFunc("/", drawLargeChart)
|
|
||||||
http.HandleFunc("/favico.ico", func(res http.ResponseWriter, req *http.Request) {
|
|
||||||
res.Write([]byte{})
|
|
||||||
})
|
|
||||||
http.ListenAndServe(":8080", nil)
|
|
||||||
}
|
|
||||||
|
Before Width: | Height: | Size: 68 KiB |
|
|
@ -1,58 +0,0 @@
|
||||||
package main
|
|
||||||
|
|
||||||
import (
|
|
||||||
"fmt"
|
|
||||||
"log"
|
|
||||||
"net/http"
|
|
||||||
|
|
||||||
"git.fireandbrimst.one/aw/go-chart"
|
|
||||||
)
|
|
||||||
|
|
||||||
// Note: Additional examples on how to add Stylesheets are in the custom_stylesheets example
|
|
||||||
|
|
||||||
func inlineSVGWithClasses(res http.ResponseWriter, req *http.Request) {
|
|
||||||
res.Write([]byte(
|
|
||||||
"<!DOCTYPE html><html><head>" +
|
|
||||||
"<link rel=\"stylesheet\" type=\"text/css\" href=\"/main.css\">" +
|
|
||||||
"</head>" +
|
|
||||||
"<body>"))
|
|
||||||
|
|
||||||
pie := chart.PieChart{
|
|
||||||
// Note that setting ClassName will cause all other inline styles to be dropped!
|
|
||||||
Background: chart.Style{ClassName: "background"},
|
|
||||||
Canvas: chart.Style{
|
|
||||||
ClassName: "canvas",
|
|
||||||
},
|
|
||||||
Width: 512,
|
|
||||||
Height: 512,
|
|
||||||
Values: []chart.Value{
|
|
||||||
{Value: 5, Label: "Blue", Style: chart.Style{ClassName: "blue"}},
|
|
||||||
{Value: 5, Label: "Green", Style: chart.Style{ClassName: "green"}},
|
|
||||||
{Value: 4, Label: "Gray", Style: chart.Style{ClassName: "gray"}},
|
|
||||||
},
|
|
||||||
}
|
|
||||||
|
|
||||||
err := pie.Render(chart.SVG, res)
|
|
||||||
if err != nil {
|
|
||||||
fmt.Printf("Error rendering pie chart: %v\n", err)
|
|
||||||
}
|
|
||||||
res.Write([]byte("</body>"))
|
|
||||||
}
|
|
||||||
|
|
||||||
func css(res http.ResponseWriter, req *http.Request) {
|
|
||||||
res.Header().Set("Content-Type", "text/css")
|
|
||||||
res.Write([]byte("svg .background { fill: white; }" +
|
|
||||||
"svg .canvas { fill: white; }" +
|
|
||||||
"svg path.blue { fill: blue; stroke: lightblue; }" +
|
|
||||||
"svg path.green { fill: green; stroke: lightgreen; }" +
|
|
||||||
"svg path.gray { fill: gray; stroke: lightgray; }" +
|
|
||||||
"svg text.blue { fill: white; }" +
|
|
||||||
"svg text.green { fill: white; }" +
|
|
||||||
"svg text.gray { fill: white; }"))
|
|
||||||
}
|
|
||||||
|
|
||||||
func main() {
|
|
||||||
http.HandleFunc("/", inlineSVGWithClasses)
|
|
||||||
http.HandleFunc("/main.css", css)
|
|
||||||
log.Fatal(http.ListenAndServe(":8080", nil))
|
|
||||||
}
|
|
||||||
|
|
@ -4,7 +4,7 @@ import (
|
||||||
"fmt"
|
"fmt"
|
||||||
"net/http"
|
"net/http"
|
||||||
|
|
||||||
"git.fireandbrimst.one/aw/go-chart"
|
"github.com/wcharczuk/go-chart"
|
||||||
)
|
)
|
||||||
|
|
||||||
func drawChart(res http.ResponseWriter, req *http.Request) {
|
func drawChart(res http.ResponseWriter, req *http.Request) {
|
||||||
|
|
@ -16,7 +16,9 @@ func drawChart(res http.ResponseWriter, req *http.Request) {
|
||||||
|
|
||||||
graph := chart.Chart{
|
graph := chart.Chart{
|
||||||
YAxis: chart.YAxis{
|
YAxis: chart.YAxis{
|
||||||
Style: chart.StyleShow(),
|
Style: chart.Style{
|
||||||
|
Show: true,
|
||||||
|
},
|
||||||
ValueFormatter: func(v interface{}) string {
|
ValueFormatter: func(v interface{}) string {
|
||||||
if vf, isFloat := v.(float64); isFloat {
|
if vf, isFloat := v.(float64); isFloat {
|
||||||
return fmt.Sprintf("%0.6f", vf)
|
return fmt.Sprintf("%0.6f", vf)
|
||||||
|
|
|
||||||
|
Before Width: | Height: | Size: 27 KiB After Width: | Height: | Size: 27 KiB |
|
|
@ -3,9 +3,8 @@ package main
|
||||||
import (
|
import (
|
||||||
"net/http"
|
"net/http"
|
||||||
|
|
||||||
"git.fireandbrimst.one/aw/go-chart"
|
"github.com/wcharczuk/go-chart"
|
||||||
"git.fireandbrimst.one/aw/go-chart/drawing"
|
"github.com/wcharczuk/go-chart/drawing"
|
||||||
"git.fireandbrimst.one/aw/go-chart/seq"
|
|
||||||
)
|
)
|
||||||
|
|
||||||
func drawChart(res http.ResponseWriter, req *http.Request) {
|
func drawChart(res http.ResponseWriter, req *http.Request) {
|
||||||
|
|
@ -20,15 +19,19 @@ func drawChart(res http.ResponseWriter, req *http.Request) {
|
||||||
FillColor: drawing.ColorFromHex("efefef"),
|
FillColor: drawing.ColorFromHex("efefef"),
|
||||||
},
|
},
|
||||||
XAxis: chart.XAxis{
|
XAxis: chart.XAxis{
|
||||||
Style: chart.StyleShow(),
|
Style: chart.Style{
|
||||||
|
Show: true,
|
||||||
|
},
|
||||||
},
|
},
|
||||||
YAxis: chart.YAxis{
|
YAxis: chart.YAxis{
|
||||||
Style: chart.StyleShow(),
|
Style: chart.Style{
|
||||||
|
Show: true,
|
||||||
|
},
|
||||||
},
|
},
|
||||||
Series: []chart.Series{
|
Series: []chart.Series{
|
||||||
chart.ContinuousSeries{
|
chart.ContinuousSeries{
|
||||||
XValues: seq.Range(1.0, 100.0),
|
XValues: chart.Sequence.Float64(1.0, 100.0),
|
||||||
YValues: seq.RandomValuesWithMax(100, 512),
|
YValues: chart.Sequence.Random(100.0, 256.0),
|
||||||
},
|
},
|
||||||
},
|
},
|
||||||
}
|
}
|
||||||
|
|
@ -43,15 +46,19 @@ func drawChartDefault(res http.ResponseWriter, req *http.Request) {
|
||||||
FillColor: drawing.ColorFromHex("efefef"),
|
FillColor: drawing.ColorFromHex("efefef"),
|
||||||
},
|
},
|
||||||
XAxis: chart.XAxis{
|
XAxis: chart.XAxis{
|
||||||
Style: chart.StyleShow(),
|
Style: chart.Style{
|
||||||
|
Show: true,
|
||||||
|
},
|
||||||
},
|
},
|
||||||
YAxis: chart.YAxis{
|
YAxis: chart.YAxis{
|
||||||
Style: chart.StyleShow(),
|
Style: chart.Style{
|
||||||
|
Show: true,
|
||||||
|
},
|
||||||
},
|
},
|
||||||
Series: []chart.Series{
|
Series: []chart.Series{
|
||||||
chart.ContinuousSeries{
|
chart.ContinuousSeries{
|
||||||
XValues: seq.Range(1.0, 100.0),
|
XValues: chart.Sequence.Float64(1.0, 100.0),
|
||||||
YValues: seq.RandomValuesWithMax(100, 512),
|
YValues: chart.Sequence.Random(100.0, 256.0),
|
||||||
},
|
},
|
||||||
},
|
},
|
||||||
}
|
}
|
||||||
|
|
|
||||||
|
Before Width: | Height: | Size: 66 KiB After Width: | Height: | Size: 64 KiB |
|
|
@ -3,7 +3,7 @@ package main
|
||||||
import (
|
import (
|
||||||
"net/http"
|
"net/http"
|
||||||
|
|
||||||
"git.fireandbrimst.one/aw/go-chart"
|
"github.com/wcharczuk/go-chart"
|
||||||
)
|
)
|
||||||
|
|
||||||
func drawChart(res http.ResponseWriter, req *http.Request) {
|
func drawChart(res http.ResponseWriter, req *http.Request) {
|
||||||
|
|
@ -14,7 +14,9 @@ func drawChart(res http.ResponseWriter, req *http.Request) {
|
||||||
|
|
||||||
graph := chart.Chart{
|
graph := chart.Chart{
|
||||||
YAxis: chart.YAxis{
|
YAxis: chart.YAxis{
|
||||||
Style: chart.StyleShow(),
|
Style: chart.Style{
|
||||||
|
Show: true,
|
||||||
|
},
|
||||||
Range: &chart.ContinuousRange{
|
Range: &chart.ContinuousRange{
|
||||||
Min: 0.0,
|
Min: 0.0,
|
||||||
Max: 10.0,
|
Max: 10.0,
|
||||||
|
|
|
||||||
|
Before Width: | Height: | Size: 12 KiB After Width: | Height: | Size: 15 KiB |
|
|
@ -3,8 +3,8 @@ package main
|
||||||
import (
|
import (
|
||||||
"net/http"
|
"net/http"
|
||||||
|
|
||||||
"git.fireandbrimst.one/aw/go-chart"
|
"github.com/wcharczuk/go-chart"
|
||||||
"git.fireandbrimst.one/aw/go-chart/drawing"
|
"github.com/wcharczuk/go-chart/drawing"
|
||||||
)
|
)
|
||||||
|
|
||||||
func drawChart(res http.ResponseWriter, req *http.Request) {
|
func drawChart(res http.ResponseWriter, req *http.Request) {
|
||||||
|
|
|
||||||
|
|
@ -1,21 +0,0 @@
|
||||||
<svg xmlns="http://www.w3.org/2000/svg" xmlns:xlink="http://www.w3.org/1999/xlink" width="512" height="512">\n<style type="text/css"><![CDATA[svg .background { fill: white; }svg .canvas { fill: white; }svg path.blue { fill: blue; stroke: lightblue; }svg path.green { fill: green; stroke: lightgreen; }svg path.gray { fill: gray; stroke: lightgray; }svg text.blue { fill: white; }svg text.green { fill: white; }svg text.gray { fill: white; }]]></style><path d="M 0 0
|
|
||||||
L 512 0
|
|
||||||
L 512 512
|
|
||||||
L 0 512
|
|
||||||
L 0 0" class="background"/><path d="M 5 5
|
|
||||||
L 507 5
|
|
||||||
L 507 507
|
|
||||||
L 5 507
|
|
||||||
L 5 5" class="canvas"/><path d="M 256 256
|
|
||||||
L 507 256
|
|
||||||
A 251 251 128.56 0 1 100 452
|
|
||||||
L 256 256
|
|
||||||
Z" class="blue"/><path d="M 256 256
|
|
||||||
L 100 452
|
|
||||||
A 251 251 128.56 0 1 201 12
|
|
||||||
L 256 256
|
|
||||||
Z" class="green"/><path d="M 256 256
|
|
||||||
L 201 12
|
|
||||||
A 251 251 102.85 0 1 506 256
|
|
||||||
L 256 256
|
|
||||||
Z" class="gray"/><text x="313" y="413" class="blue">Blue</text><text x="73" y="226" class="green">Green</text><text x="344" y="133" class="gray">Gray</text></svg>
|
|
||||||
|
Before Width: | Height: | Size: 987 B |
|
|
@ -1,87 +0,0 @@
|
||||||
package main
|
|
||||||
|
|
||||||
import (
|
|
||||||
"fmt"
|
|
||||||
"github.com/hashworks/go-chart"
|
|
||||||
"log"
|
|
||||||
"net/http"
|
|
||||||
)
|
|
||||||
|
|
||||||
const style = "svg .background { fill: white; }" +
|
|
||||||
"svg .canvas { fill: white; }" +
|
|
||||||
"svg path.blue { fill: blue; stroke: lightblue; }" +
|
|
||||||
"svg path.green { fill: green; stroke: lightgreen; }" +
|
|
||||||
"svg path.gray { fill: gray; stroke: lightgray; }" +
|
|
||||||
"svg text.blue { fill: white; }" +
|
|
||||||
"svg text.green { fill: white; }" +
|
|
||||||
"svg text.gray { fill: white; }"
|
|
||||||
|
|
||||||
func svgWithCustomInlineCSS(res http.ResponseWriter, _ *http.Request) {
|
|
||||||
res.Header().Set("Content-Type", chart.ContentTypeSVG)
|
|
||||||
|
|
||||||
// Render the CSS with custom css
|
|
||||||
err := pieChart().Render(chart.SVGWithCSS(style, ""), res)
|
|
||||||
if err != nil {
|
|
||||||
fmt.Printf("Error rendering pie chart: %v\n", err)
|
|
||||||
}
|
|
||||||
}
|
|
||||||
|
|
||||||
func svgWithCustomInlineCSSNonce(res http.ResponseWriter, _ *http.Request) {
|
|
||||||
// https://developer.mozilla.org/en-US/docs/Web/HTTP/Headers/Content-Security-Policy/style-src
|
|
||||||
// This should be randomly generated on every request!
|
|
||||||
const nonce = "RAND0MBASE64"
|
|
||||||
|
|
||||||
res.Header().Set("Content-Security-Policy", fmt.Sprintf("style-src 'nonce-%s'", nonce))
|
|
||||||
res.Header().Set("Content-Type", chart.ContentTypeSVG)
|
|
||||||
|
|
||||||
// Render the CSS with custom css and a nonce.
|
|
||||||
// Try changing the nonce to a different string - your browser should block the CSS.
|
|
||||||
err := pieChart().Render(chart.SVGWithCSS(style, nonce), res)
|
|
||||||
if err != nil {
|
|
||||||
fmt.Printf("Error rendering pie chart: %v\n", err)
|
|
||||||
}
|
|
||||||
}
|
|
||||||
|
|
||||||
func svgWithCustomExternalCSS(res http.ResponseWriter, _ *http.Request) {
|
|
||||||
// Add external CSS
|
|
||||||
res.Write([]byte(
|
|
||||||
`<?xml version="1.0" standalone="no"?>`+
|
|
||||||
`<?xml-stylesheet href="/main.css" type="text/css"?>`+
|
|
||||||
`<!DOCTYPE svg PUBLIC "-//W3C//DTD SVG 1.1//EN" "http://www.w3.org/Graphics/SVG/1.1/DTD/svg11.dtd">`))
|
|
||||||
|
|
||||||
res.Header().Set("Content-Type", chart.ContentTypeSVG)
|
|
||||||
err := pieChart().Render(chart.SVG, res)
|
|
||||||
if err != nil {
|
|
||||||
fmt.Printf("Error rendering pie chart: %v\n", err)
|
|
||||||
}
|
|
||||||
}
|
|
||||||
|
|
||||||
func pieChart() chart.PieChart {
|
|
||||||
return chart.PieChart{
|
|
||||||
// Note that setting ClassName will cause all other inline styles to be dropped!
|
|
||||||
Background: chart.Style{ClassName: "background"},
|
|
||||||
Canvas: chart.Style{
|
|
||||||
ClassName: "canvas",
|
|
||||||
},
|
|
||||||
Width: 512,
|
|
||||||
Height: 512,
|
|
||||||
Values: []chart.Value{
|
|
||||||
{Value: 5, Label: "Blue", Style: chart.Style{ClassName: "blue"}},
|
|
||||||
{Value: 5, Label: "Green", Style: chart.Style{ClassName: "green"}},
|
|
||||||
{Value: 4, Label: "Gray", Style: chart.Style{ClassName: "gray"}},
|
|
||||||
},
|
|
||||||
}
|
|
||||||
}
|
|
||||||
|
|
||||||
func css(res http.ResponseWriter, req *http.Request) {
|
|
||||||
res.Header().Set("Content-Type", "text/css")
|
|
||||||
res.Write([]byte(style))
|
|
||||||
}
|
|
||||||
|
|
||||||
func main() {
|
|
||||||
http.HandleFunc("/", svgWithCustomInlineCSS)
|
|
||||||
http.HandleFunc("/nonce", svgWithCustomInlineCSSNonce)
|
|
||||||
http.HandleFunc("/external", svgWithCustomExternalCSS)
|
|
||||||
http.HandleFunc("/main.css", css)
|
|
||||||
log.Fatal(http.ListenAndServe(":8080", nil))
|
|
||||||
}
|
|
||||||
|
|
@ -3,7 +3,7 @@ package main
|
||||||
import (
|
import (
|
||||||
"net/http"
|
"net/http"
|
||||||
|
|
||||||
"git.fireandbrimst.one/aw/go-chart"
|
"github.com/wcharczuk/go-chart"
|
||||||
)
|
)
|
||||||
|
|
||||||
func drawChart(res http.ResponseWriter, req *http.Request) {
|
func drawChart(res http.ResponseWriter, req *http.Request) {
|
||||||
|
|
@ -14,7 +14,9 @@ func drawChart(res http.ResponseWriter, req *http.Request) {
|
||||||
|
|
||||||
graph := chart.Chart{
|
graph := chart.Chart{
|
||||||
YAxis: chart.YAxis{
|
YAxis: chart.YAxis{
|
||||||
Style: chart.StyleShow(),
|
Style: chart.Style{
|
||||||
|
Show: true,
|
||||||
|
},
|
||||||
Range: &chart.ContinuousRange{
|
Range: &chart.ContinuousRange{
|
||||||
Min: 0.0,
|
Min: 0.0,
|
||||||
Max: 4.0,
|
Max: 4.0,
|
||||||
|
|
|
||||||
|
Before Width: | Height: | Size: 11 KiB After Width: | Height: | Size: 10 KiB |
|
|
@ -3,7 +3,7 @@ package main
|
||||||
import (
|
import (
|
||||||
"net/http"
|
"net/http"
|
||||||
|
|
||||||
"git.fireandbrimst.one/aw/go-chart"
|
"github.com/wcharczuk/go-chart"
|
||||||
)
|
)
|
||||||
|
|
||||||
func drawChart(res http.ResponseWriter, req *http.Request) {
|
func drawChart(res http.ResponseWriter, req *http.Request) {
|
||||||
|
|
@ -20,13 +20,17 @@ func drawChart(res http.ResponseWriter, req *http.Request) {
|
||||||
Height: 500,
|
Height: 500,
|
||||||
Width: 500,
|
Width: 500,
|
||||||
XAxis: chart.XAxis{
|
XAxis: chart.XAxis{
|
||||||
Style: chart.StyleShow(),
|
Style: chart.Style{
|
||||||
|
Show: true,
|
||||||
|
},
|
||||||
/*Range: &chart.ContinuousRange{
|
/*Range: &chart.ContinuousRange{
|
||||||
Descending: true,
|
Descending: true,
|
||||||
},*/
|
},*/
|
||||||
},
|
},
|
||||||
YAxis: chart.YAxis{
|
YAxis: chart.YAxis{
|
||||||
Style: chart.StyleShow(),
|
Style: chart.Style{
|
||||||
|
Show: true,
|
||||||
|
},
|
||||||
Range: &chart.ContinuousRange{
|
Range: &chart.ContinuousRange{
|
||||||
Descending: true,
|
Descending: true,
|
||||||
},
|
},
|
||||||
|
|
|
||||||
|
Before Width: | Height: | Size: 19 KiB |
|
|
@ -4,7 +4,7 @@ import (
|
||||||
"fmt"
|
"fmt"
|
||||||
"log"
|
"log"
|
||||||
|
|
||||||
"git.fireandbrimst.one/aw/go-chart"
|
"github.com/wcharczuk/go-chart"
|
||||||
)
|
)
|
||||||
|
|
||||||
func main() {
|
func main() {
|
||||||
|
|
|
||||||
|
|
@ -3,7 +3,7 @@ package main
|
||||||
import (
|
import (
|
||||||
"net/http"
|
"net/http"
|
||||||
|
|
||||||
"git.fireandbrimst.one/aw/go-chart"
|
"github.com/wcharczuk/go-chart"
|
||||||
)
|
)
|
||||||
|
|
||||||
func drawChart(res http.ResponseWriter, req *http.Request) {
|
func drawChart(res http.ResponseWriter, req *http.Request) {
|
||||||
|
|
@ -16,10 +16,10 @@ func drawChart(res http.ResponseWriter, req *http.Request) {
|
||||||
|
|
||||||
graph := chart.Chart{
|
graph := chart.Chart{
|
||||||
XAxis: chart.XAxis{
|
XAxis: chart.XAxis{
|
||||||
Style: chart.StyleShow(),
|
Style: chart.Style{Show: true},
|
||||||
},
|
},
|
||||||
YAxis: chart.YAxis{
|
YAxis: chart.YAxis{
|
||||||
Style: chart.StyleShow(),
|
Style: chart.Style{Show: true},
|
||||||
},
|
},
|
||||||
Background: chart.Style{
|
Background: chart.Style{
|
||||||
Padding: chart.Box{
|
Padding: chart.Box{
|
||||||
|
|
|
||||||
|
Before Width: | Height: | Size: 24 KiB After Width: | Height: | Size: 23 KiB |
|
|
@ -3,7 +3,7 @@ package main
|
||||||
import (
|
import (
|
||||||
"net/http"
|
"net/http"
|
||||||
|
|
||||||
"git.fireandbrimst.one/aw/go-chart"
|
"github.com/wcharczuk/go-chart"
|
||||||
)
|
)
|
||||||
|
|
||||||
func drawChart(res http.ResponseWriter, req *http.Request) {
|
func drawChart(res http.ResponseWriter, req *http.Request) {
|
||||||
|
|
@ -16,10 +16,10 @@ func drawChart(res http.ResponseWriter, req *http.Request) {
|
||||||
|
|
||||||
graph := chart.Chart{
|
graph := chart.Chart{
|
||||||
XAxis: chart.XAxis{
|
XAxis: chart.XAxis{
|
||||||
Style: chart.StyleShow(),
|
Style: chart.Style{Show: true},
|
||||||
},
|
},
|
||||||
YAxis: chart.YAxis{
|
YAxis: chart.YAxis{
|
||||||
Style: chart.StyleShow(),
|
Style: chart.Style{Show: true},
|
||||||
},
|
},
|
||||||
Background: chart.Style{
|
Background: chart.Style{
|
||||||
Padding: chart.Box{
|
Padding: chart.Box{
|
||||||
|
|
|
||||||
|
|
@ -3,21 +3,20 @@ package main
|
||||||
import (
|
import (
|
||||||
"net/http"
|
"net/http"
|
||||||
|
|
||||||
"git.fireandbrimst.one/aw/go-chart"
|
"github.com/wcharczuk/go-chart"
|
||||||
"git.fireandbrimst.one/aw/go-chart/seq"
|
|
||||||
)
|
)
|
||||||
|
|
||||||
func drawChart(res http.ResponseWriter, req *http.Request) {
|
func drawChart(res http.ResponseWriter, req *http.Request) {
|
||||||
|
|
||||||
/*
|
/*
|
||||||
In this example we add a new type of series, a `SimpleMovingAverageSeries` that takes another series as a required argument.
|
In this example we add a new type of series, a `SimpleMovingAverageSeries` that takes another series as a required argument.
|
||||||
InnerSeries only needs to implement `ValuesProvider`, so really you could chain `SimpleMovingAverageSeries` together if you wanted.
|
InnerSeries only needs to implement `ValueProvider`, so really you could chain `SimpleMovingAverageSeries` together if you wanted.
|
||||||
*/
|
*/
|
||||||
|
|
||||||
mainSeries := chart.ContinuousSeries{
|
mainSeries := chart.ContinuousSeries{
|
||||||
Name: "A test series",
|
Name: "A test series",
|
||||||
XValues: seq.Range(1.0, 100.0), //generates a []float64 from 1.0 to 100.0 in 1.0 step increments, or 100 elements.
|
XValues: chart.Sequence.Float64(1.0, 100.0), //generates a []float64 from 1.0 to 100.0 in 1.0 step increments, or 100 elements.
|
||||||
YValues: seq.RandomValuesWithMax(100, 100), //generates a []float64 randomly from 0 to 100 with 100 elements.
|
YValues: chart.Sequence.Random(100, 100), //generates a []float64 randomly from 0 to 100 with 100 elements.
|
||||||
}
|
}
|
||||||
|
|
||||||
// note we create a LinearRegressionSeries series by assignin the inner series.
|
// note we create a LinearRegressionSeries series by assignin the inner series.
|
||||||
|
|
|
||||||
44
_examples/market_hours/main.go
Normal file
|
|
@ -0,0 +1,44 @@
|
||||||
|
package main
|
||||||
|
|
||||||
|
import (
|
||||||
|
"net/http"
|
||||||
|
|
||||||
|
"github.com/wcharczuk/go-chart"
|
||||||
|
)
|
||||||
|
|
||||||
|
func drawChart(res http.ResponseWriter, req *http.Request) {
|
||||||
|
start := chart.Date.Date(2016, 7, 01, chart.Date.Eastern())
|
||||||
|
end := chart.Date.Date(2016, 07, 21, chart.Date.Eastern())
|
||||||
|
xv := chart.Sequence.MarketHours(start, end, chart.NYSEOpen, chart.NYSEClose, chart.Date.IsNYSEHoliday)
|
||||||
|
yv := chart.Sequence.RandomWithAverage(len(xv), 200, 10)
|
||||||
|
|
||||||
|
graph := chart.Chart{
|
||||||
|
XAxis: chart.XAxis{
|
||||||
|
Style: chart.StyleShow(),
|
||||||
|
TickPosition: chart.TickPositionBetweenTicks,
|
||||||
|
ValueFormatter: chart.TimeHourValueFormatter,
|
||||||
|
Range: &chart.MarketHoursRange{
|
||||||
|
MarketOpen: chart.NYSEOpen,
|
||||||
|
MarketClose: chart.NYSEClose,
|
||||||
|
HolidayProvider: chart.Date.IsNYSEHoliday,
|
||||||
|
},
|
||||||
|
},
|
||||||
|
YAxis: chart.YAxis{
|
||||||
|
Style: chart.StyleShow(),
|
||||||
|
},
|
||||||
|
Series: []chart.Series{
|
||||||
|
chart.TimeSeries{
|
||||||
|
XValues: xv,
|
||||||
|
YValues: yv,
|
||||||
|
},
|
||||||
|
},
|
||||||
|
}
|
||||||
|
|
||||||
|
res.Header().Set("Content-Type", "image/png")
|
||||||
|
graph.Render(chart.PNG, res)
|
||||||
|
}
|
||||||
|
|
||||||
|
func main() {
|
||||||
|
http.HandleFunc("/", drawChart)
|
||||||
|
http.ListenAndServe(":8080", nil)
|
||||||
|
}
|
||||||
BIN
_examples/market_hours/output.png
Normal file
|
After Width: | Height: | Size: 67 KiB |
|
|
@ -3,15 +3,14 @@ package main
|
||||||
import (
|
import (
|
||||||
"net/http"
|
"net/http"
|
||||||
|
|
||||||
"git.fireandbrimst.one/aw/go-chart"
|
"github.com/wcharczuk/go-chart"
|
||||||
"git.fireandbrimst.one/aw/go-chart/seq"
|
|
||||||
)
|
)
|
||||||
|
|
||||||
func drawChart(res http.ResponseWriter, req *http.Request) {
|
func drawChart(res http.ResponseWriter, req *http.Request) {
|
||||||
mainSeries := chart.ContinuousSeries{
|
mainSeries := chart.ContinuousSeries{
|
||||||
Name: "A test series",
|
Name: "A test series",
|
||||||
XValues: seq.Range(1.0, 100.0),
|
XValues: chart.Sequence.Float64(1.0, 100.0),
|
||||||
YValues: seq.New(seq.NewRandom().WithLen(100).WithMax(150).WithMin(50)).Array(),
|
YValues: chart.Sequence.RandomWithAverage(100, 100, 50),
|
||||||
}
|
}
|
||||||
|
|
||||||
minSeries := &chart.MinSeries{
|
minSeries := &chart.MinSeries{
|
||||||
|
|
|
||||||
|
|
@ -5,7 +5,7 @@ import (
|
||||||
"log"
|
"log"
|
||||||
"net/http"
|
"net/http"
|
||||||
|
|
||||||
"git.fireandbrimst.one/aw/go-chart"
|
"github.com/wcharczuk/go-chart"
|
||||||
)
|
)
|
||||||
|
|
||||||
func drawChart(res http.ResponseWriter, req *http.Request) {
|
func drawChart(res http.ResponseWriter, req *http.Request) {
|
||||||
|
|
@ -30,26 +30,7 @@ func drawChart(res http.ResponseWriter, req *http.Request) {
|
||||||
}
|
}
|
||||||
}
|
}
|
||||||
|
|
||||||
func drawChartRegression(res http.ResponseWriter, req *http.Request) {
|
|
||||||
pie := chart.PieChart{
|
|
||||||
Width: 512,
|
|
||||||
Height: 512,
|
|
||||||
Values: []chart.Value{
|
|
||||||
{Value: 5, Label: "Blue"},
|
|
||||||
{Value: 2, Label: "Two"},
|
|
||||||
{Value: 1, Label: "One"},
|
|
||||||
},
|
|
||||||
}
|
|
||||||
|
|
||||||
res.Header().Set("Content-Type", chart.ContentTypeSVG)
|
|
||||||
err := pie.Render(chart.SVG, res)
|
|
||||||
if err != nil {
|
|
||||||
fmt.Printf("Error rendering pie chart: %v\n", err)
|
|
||||||
}
|
|
||||||
}
|
|
||||||
|
|
||||||
func main() {
|
func main() {
|
||||||
http.HandleFunc("/", drawChart)
|
http.HandleFunc("/", drawChart)
|
||||||
http.HandleFunc("/reg", drawChartRegression)
|
|
||||||
log.Fatal(http.ListenAndServe(":8080", nil))
|
log.Fatal(http.ListenAndServe(":8080", nil))
|
||||||
}
|
}
|
||||||
|
|
|
||||||
|
Before Width: | Height: | Size: 34 KiB After Width: | Height: | Size: 34 KiB |
|
|
@ -1,17 +0,0 @@
|
||||||
<svg xmlns="http://www.w3.org/2000/svg" xmlns:xlink="http://www.w3.org/1999/xlink" width="512" height="512">
|
|
||||||
<path d="M 256 256
|
|
||||||
L 507 256
|
|
||||||
A 251 251 225.00 1 1 79 79
|
|
||||||
L 256 256
|
|
||||||
Z" style="stroke-width:5;stroke:rgba(255,255,255,1.0);fill:rgba(106,195,203,1.0)"/>
|
|
||||||
<path d="M 256 256
|
|
||||||
L 79 79
|
|
||||||
A 251 251 90.00 0 1 433 79
|
|
||||||
L 256 256
|
|
||||||
Z" style="stroke-width:5;stroke:rgba(255,255,255,1.0);fill:rgba(42,190,137,1.0)"/>
|
|
||||||
<path d="M 256 256
|
|
||||||
L 433 79
|
|
||||||
A 251 251 45.00 0 1 507 256
|
|
||||||
L 256 256
|
|
||||||
Z" style="stroke-width:5;stroke:rgba(255,255,255,1.0);fill:rgba(110,128,139,1.0)"/>
|
|
||||||
</svg>
|
|
||||||
|
Before Width: | Height: | Size: 565 B |
|
|
@ -1,42 +0,0 @@
|
||||||
package main
|
|
||||||
|
|
||||||
import (
|
|
||||||
"net/http"
|
|
||||||
|
|
||||||
"git.fireandbrimst.one/aw/go-chart"
|
|
||||||
"git.fireandbrimst.one/aw/go-chart/seq"
|
|
||||||
)
|
|
||||||
|
|
||||||
func drawChart(res http.ResponseWriter, req *http.Request) {
|
|
||||||
|
|
||||||
/*
|
|
||||||
In this example we add a new type of series, a `PolynomialRegressionSeries` that takes another series as a required argument.
|
|
||||||
InnerSeries only needs to implement `ValuesProvider`, so really you could chain `PolynomialRegressionSeries` together if you wanted.
|
|
||||||
*/
|
|
||||||
|
|
||||||
mainSeries := chart.ContinuousSeries{
|
|
||||||
Name: "A test series",
|
|
||||||
XValues: seq.Range(1.0, 100.0), //generates a []float64 from 1.0 to 100.0 in 1.0 step increments, or 100 elements.
|
|
||||||
YValues: seq.RandomValuesWithMax(100, 100), //generates a []float64 randomly from 0 to 100 with 100 elements.
|
|
||||||
}
|
|
||||||
|
|
||||||
polyRegSeries := &chart.PolynomialRegressionSeries{
|
|
||||||
Degree: 3,
|
|
||||||
InnerSeries: mainSeries,
|
|
||||||
}
|
|
||||||
|
|
||||||
graph := chart.Chart{
|
|
||||||
Series: []chart.Series{
|
|
||||||
mainSeries,
|
|
||||||
polyRegSeries,
|
|
||||||
},
|
|
||||||
}
|
|
||||||
|
|
||||||
res.Header().Set("Content-Type", "image/png")
|
|
||||||
graph.Render(chart.PNG, res)
|
|
||||||
}
|
|
||||||
|
|
||||||
func main() {
|
|
||||||
http.HandleFunc("/", drawChart)
|
|
||||||
http.ListenAndServe(":8080", nil)
|
|
||||||
}
|
|
||||||
|
Before Width: | Height: | Size: 54 KiB |
|
|
@ -7,8 +7,7 @@ import (
|
||||||
"strings"
|
"strings"
|
||||||
"time"
|
"time"
|
||||||
|
|
||||||
"git.fireandbrimst.one/aw/go-chart"
|
"github.com/wcharczuk/go-chart"
|
||||||
util "git.fireandbrimst.one/aw/go-chart/util"
|
|
||||||
)
|
)
|
||||||
|
|
||||||
func parseInt(str string) int {
|
func parseInt(str string) int {
|
||||||
|
|
@ -24,7 +23,7 @@ func parseFloat64(str string) float64 {
|
||||||
func readData() ([]time.Time, []float64) {
|
func readData() ([]time.Time, []float64) {
|
||||||
var xvalues []time.Time
|
var xvalues []time.Time
|
||||||
var yvalues []float64
|
var yvalues []float64
|
||||||
err := util.File.ReadByLines("requests.csv", func(line string) error {
|
err := chart.File.ReadByLines("requests.csv", func(line string) {
|
||||||
parts := strings.Split(line, ",")
|
parts := strings.Split(line, ",")
|
||||||
year := parseInt(parts[0])
|
year := parseInt(parts[0])
|
||||||
month := parseInt(parts[1])
|
month := parseInt(parts[1])
|
||||||
|
|
@ -33,7 +32,6 @@ func readData() ([]time.Time, []float64) {
|
||||||
elapsedMillis := parseFloat64(parts[4])
|
elapsedMillis := parseFloat64(parts[4])
|
||||||
xvalues = append(xvalues, time.Date(year, time.Month(month), day, hour, 0, 0, 0, time.UTC))
|
xvalues = append(xvalues, time.Date(year, time.Month(month), day, hour, 0, 0, 0, time.UTC))
|
||||||
yvalues = append(yvalues, elapsedMillis)
|
yvalues = append(yvalues, elapsedMillis)
|
||||||
return nil
|
|
||||||
})
|
})
|
||||||
if err != nil {
|
if err != nil {
|
||||||
fmt.Println(err.Error())
|
fmt.Println(err.Error())
|
||||||
|
|
@ -43,12 +41,12 @@ func readData() ([]time.Time, []float64) {
|
||||||
|
|
||||||
func releases() []chart.GridLine {
|
func releases() []chart.GridLine {
|
||||||
return []chart.GridLine{
|
return []chart.GridLine{
|
||||||
{Value: util.Time.ToFloat64(time.Date(2016, 8, 1, 9, 30, 0, 0, time.UTC))},
|
{Value: chart.Time.ToFloat64(time.Date(2016, 8, 1, 9, 30, 0, 0, time.UTC))},
|
||||||
{Value: util.Time.ToFloat64(time.Date(2016, 8, 2, 9, 30, 0, 0, time.UTC))},
|
{Value: chart.Time.ToFloat64(time.Date(2016, 8, 2, 9, 30, 0, 0, time.UTC))},
|
||||||
{Value: util.Time.ToFloat64(time.Date(2016, 8, 2, 15, 30, 0, 0, time.UTC))},
|
{Value: chart.Time.ToFloat64(time.Date(2016, 8, 2, 15, 30, 0, 0, time.UTC))},
|
||||||
{Value: util.Time.ToFloat64(time.Date(2016, 8, 4, 9, 30, 0, 0, time.UTC))},
|
{Value: chart.Time.ToFloat64(time.Date(2016, 8, 4, 9, 30, 0, 0, time.UTC))},
|
||||||
{Value: util.Time.ToFloat64(time.Date(2016, 8, 5, 9, 30, 0, 0, time.UTC))},
|
{Value: chart.Time.ToFloat64(time.Date(2016, 8, 5, 9, 30, 0, 0, time.UTC))},
|
||||||
{Value: util.Time.ToFloat64(time.Date(2016, 8, 6, 9, 30, 0, 0, time.UTC))},
|
{Value: chart.Time.ToFloat64(time.Date(2016, 8, 6, 9, 30, 0, 0, time.UTC))},
|
||||||
}
|
}
|
||||||
}
|
}
|
||||||
|
|
||||||
|
|
@ -105,7 +103,9 @@ func drawChart(res http.ResponseWriter, req *http.Request) {
|
||||||
},
|
},
|
||||||
},
|
},
|
||||||
XAxis: chart.XAxis{
|
XAxis: chart.XAxis{
|
||||||
Style: chart.StyleShow(),
|
Style: chart.Style{
|
||||||
|
Show: true,
|
||||||
|
},
|
||||||
ValueFormatter: chart.TimeHourValueFormatter,
|
ValueFormatter: chart.TimeHourValueFormatter,
|
||||||
GridMajorStyle: chart.Style{
|
GridMajorStyle: chart.Style{
|
||||||
Show: true,
|
Show: true,
|
||||||
|
|
@ -125,7 +125,7 @@ func drawChart(res http.ResponseWriter, req *http.Request) {
|
||||||
|
|
||||||
graph.Elements = []chart.Renderable{chart.LegendThin(&graph)}
|
graph.Elements = []chart.Renderable{chart.LegendThin(&graph)}
|
||||||
|
|
||||||
res.Header().Set("Content-Type", chart.ContentTypePNG)
|
res.Header().Set("Content-Type", "image/png")
|
||||||
graph.Render(chart.PNG, res)
|
graph.Render(chart.PNG, res)
|
||||||
}
|
}
|
||||||
|
|
||||||
|
|
|
||||||
|
|
@ -1,50 +0,0 @@
|
||||||
package main
|
|
||||||
|
|
||||||
import (
|
|
||||||
"log"
|
|
||||||
"net/http"
|
|
||||||
"sync"
|
|
||||||
"time"
|
|
||||||
|
|
||||||
"git.fireandbrimst.one/aw/go-chart/util"
|
|
||||||
|
|
||||||
chart "git.fireandbrimst.one/aw/go-chart"
|
|
||||||
)
|
|
||||||
|
|
||||||
var lock sync.Mutex
|
|
||||||
var graph *chart.Chart
|
|
||||||
var ts *chart.TimeSeries
|
|
||||||
|
|
||||||
func addData(t time.Time, e time.Duration) {
|
|
||||||
lock.Lock()
|
|
||||||
ts.XValues = append(ts.XValues, t)
|
|
||||||
ts.YValues = append(ts.YValues, util.Time.Millis(e))
|
|
||||||
lock.Unlock()
|
|
||||||
}
|
|
||||||
|
|
||||||
func drawChart(res http.ResponseWriter, req *http.Request) {
|
|
||||||
start := time.Now()
|
|
||||||
defer func() {
|
|
||||||
addData(start, time.Since(start))
|
|
||||||
}()
|
|
||||||
if len(ts.XValues) == 0 {
|
|
||||||
http.Error(res, "no data (yet)", http.StatusBadRequest)
|
|
||||||
return
|
|
||||||
}
|
|
||||||
res.Header().Set("Content-Type", "image/png")
|
|
||||||
if err := graph.Render(chart.PNG, res); err != nil {
|
|
||||||
log.Printf("%v", err)
|
|
||||||
}
|
|
||||||
}
|
|
||||||
|
|
||||||
func main() {
|
|
||||||
ts = &chart.TimeSeries{
|
|
||||||
XValues: []time.Time{},
|
|
||||||
YValues: []float64{},
|
|
||||||
}
|
|
||||||
graph = &chart.Chart{
|
|
||||||
Series: []chart.Series{ts},
|
|
||||||
}
|
|
||||||
http.HandleFunc("/", drawChart)
|
|
||||||
log.Fatal(http.ListenAndServe(":8080", nil))
|
|
||||||
}
|
|
||||||
|
|
@ -4,39 +4,48 @@ import (
|
||||||
"log"
|
"log"
|
||||||
"net/http"
|
"net/http"
|
||||||
|
|
||||||
_ "net/http/pprof"
|
"github.com/wcharczuk/go-chart"
|
||||||
|
|
||||||
"git.fireandbrimst.one/aw/go-chart"
|
|
||||||
"git.fireandbrimst.one/aw/go-chart/drawing"
|
|
||||||
"git.fireandbrimst.one/aw/go-chart/seq"
|
|
||||||
)
|
)
|
||||||
|
|
||||||
func drawChart(res http.ResponseWriter, req *http.Request) {
|
func drawChart(res http.ResponseWriter, req *http.Request) {
|
||||||
|
|
||||||
viridisByY := func(xr, yr chart.Range, index int, x, y float64) drawing.Color {
|
|
||||||
return chart.Viridis(y, yr.GetMin(), yr.GetMax())
|
|
||||||
}
|
|
||||||
|
|
||||||
graph := chart.Chart{
|
graph := chart.Chart{
|
||||||
Series: []chart.Series{
|
Series: []chart.Series{
|
||||||
chart.ContinuousSeries{
|
chart.ContinuousSeries{
|
||||||
Style: chart.Style{
|
Style: chart.Style{
|
||||||
Show: true,
|
Show: true,
|
||||||
StrokeWidth: chart.Disabled,
|
StrokeWidth: chart.Disabled,
|
||||||
DotWidth: 5,
|
DotWidth: 3,
|
||||||
DotColorProvider: viridisByY,
|
|
||||||
},
|
},
|
||||||
XValues: seq.Range(0, 127),
|
XValues: chart.Sequence.Random(32, 1024),
|
||||||
YValues: seq.New(seq.NewRandom().WithLen(128).WithMax(1024)).Array(),
|
YValues: chart.Sequence.Random(32, 1024),
|
||||||
|
},
|
||||||
|
chart.ContinuousSeries{
|
||||||
|
Style: chart.Style{
|
||||||
|
Show: true,
|
||||||
|
StrokeWidth: chart.Disabled,
|
||||||
|
DotWidth: 5,
|
||||||
|
},
|
||||||
|
XValues: chart.Sequence.Random(16, 1024),
|
||||||
|
YValues: chart.Sequence.Random(16, 1024),
|
||||||
|
},
|
||||||
|
chart.ContinuousSeries{
|
||||||
|
Style: chart.Style{
|
||||||
|
Show: true,
|
||||||
|
StrokeWidth: chart.Disabled,
|
||||||
|
DotWidth: 7,
|
||||||
|
},
|
||||||
|
XValues: chart.Sequence.Random(8, 1024),
|
||||||
|
YValues: chart.Sequence.Random(8, 1024),
|
||||||
},
|
},
|
||||||
},
|
},
|
||||||
}
|
}
|
||||||
|
|
||||||
res.Header().Set("Content-Type", chart.ContentTypePNG)
|
res.Header().Set("Content-Type", "image/png")
|
||||||
err := graph.Render(chart.PNG, res)
|
err := graph.Render(chart.PNG, res)
|
||||||
if err != nil {
|
if err != nil {
|
||||||
log.Println(err.Error())
|
log.Println(err.Error())
|
||||||
}
|
}
|
||||||
|
|
||||||
}
|
}
|
||||||
|
|
||||||
func unit(res http.ResponseWriter, req *http.Request) {
|
func unit(res http.ResponseWriter, req *http.Request) {
|
||||||
|
|
@ -44,20 +53,20 @@ func unit(res http.ResponseWriter, req *http.Request) {
|
||||||
Height: 50,
|
Height: 50,
|
||||||
Width: 50,
|
Width: 50,
|
||||||
Canvas: chart.Style{
|
Canvas: chart.Style{
|
||||||
Padding: chart.BoxZero,
|
Padding: chart.Box{IsSet: true},
|
||||||
},
|
},
|
||||||
Background: chart.Style{
|
Background: chart.Style{
|
||||||
Padding: chart.BoxZero,
|
Padding: chart.Box{IsSet: true},
|
||||||
},
|
},
|
||||||
Series: []chart.Series{
|
Series: []chart.Series{
|
||||||
chart.ContinuousSeries{
|
chart.ContinuousSeries{
|
||||||
XValues: seq.RangeWithStep(0, 4, 1),
|
XValues: chart.Sequence.Float64(0, 4, 1),
|
||||||
YValues: seq.RangeWithStep(0, 4, 1),
|
YValues: chart.Sequence.Float64(0, 4, 1),
|
||||||
},
|
},
|
||||||
},
|
},
|
||||||
}
|
}
|
||||||
|
|
||||||
res.Header().Set("Content-Type", chart.ContentTypePNG)
|
res.Header().Set("Content-Type", "image/png")
|
||||||
err := graph.Render(chart.PNG, res)
|
err := graph.Render(chart.PNG, res)
|
||||||
if err != nil {
|
if err != nil {
|
||||||
log.Println(err.Error())
|
log.Println(err.Error())
|
||||||
|
|
|
||||||
|
Before Width: | Height: | Size: 26 KiB After Width: | Height: | Size: 12 KiB |
|
|
@ -3,16 +3,20 @@ package main
|
||||||
import (
|
import (
|
||||||
"net/http"
|
"net/http"
|
||||||
|
|
||||||
"git.fireandbrimst.one/aw/go-chart"
|
"github.com/wcharczuk/go-chart"
|
||||||
"git.fireandbrimst.one/aw/go-chart/seq"
|
|
||||||
)
|
)
|
||||||
|
|
||||||
func drawChart(res http.ResponseWriter, req *http.Request) {
|
func drawChart(res http.ResponseWriter, req *http.Request) {
|
||||||
|
|
||||||
|
/*
|
||||||
|
In this example we add a new type of series, a `SimpleMovingAverageSeries` that takes another series as a required argument.
|
||||||
|
InnerSeries only needs to implement `ValueProvider`, so really you could chain `SimpleMovingAverageSeries` together if you wanted.
|
||||||
|
*/
|
||||||
|
|
||||||
mainSeries := chart.ContinuousSeries{
|
mainSeries := chart.ContinuousSeries{
|
||||||
Name: "A test series",
|
Name: "A test series",
|
||||||
XValues: seq.Range(1.0, 100.0), //generates a []float64 from 1.0 to 100.0 in 1.0 step increments, or 100 elements.
|
XValues: chart.Sequence.Float64(1.0, 100.0), //generates a []float64 from 1.0 to 100.0 in 1.0 step increments, or 100 elements.
|
||||||
YValues: seq.RandomValuesWithMax(100, 100), //generates a []float64 randomly from 0 to 100 with 100 elements.
|
YValues: chart.Sequence.Random(100, 100), //generates a []float64 randomly from 0 to 100 with 100 elements.
|
||||||
}
|
}
|
||||||
|
|
||||||
// note we create a SimpleMovingAverage series by assignin the inner series.
|
// note we create a SimpleMovingAverage series by assignin the inner series.
|
||||||
|
|
|
||||||
|
|
@ -5,21 +5,18 @@ import (
|
||||||
"log"
|
"log"
|
||||||
"net/http"
|
"net/http"
|
||||||
|
|
||||||
"git.fireandbrimst.one/aw/go-chart"
|
"github.com/wcharczuk/go-chart"
|
||||||
)
|
)
|
||||||
|
|
||||||
func drawChart(res http.ResponseWriter, req *http.Request) {
|
func drawChart(res http.ResponseWriter, req *http.Request) {
|
||||||
sbc := chart.StackedBarChart{
|
sbc := chart.StackedBarChart{
|
||||||
Title: "Test Stacked Bar Chart",
|
|
||||||
TitleStyle: chart.StyleShow(),
|
|
||||||
Background: chart.Style{
|
|
||||||
Padding: chart.Box{
|
|
||||||
Top: 40,
|
|
||||||
},
|
|
||||||
},
|
|
||||||
Height: 512,
|
Height: 512,
|
||||||
XAxis: chart.StyleShow(),
|
XAxis: chart.Style{
|
||||||
YAxis: chart.StyleShow(),
|
Show: true,
|
||||||
|
},
|
||||||
|
YAxis: chart.Style{
|
||||||
|
Show: true,
|
||||||
|
},
|
||||||
Bars: []chart.StackedBar{
|
Bars: []chart.StackedBar{
|
||||||
{
|
{
|
||||||
Name: "This is a very long string to test word break wrapping.",
|
Name: "This is a very long string to test word break wrapping.",
|
||||||
|
|
|
||||||
|
Before Width: | Height: | Size: 17 KiB After Width: | Height: | Size: 17 KiB |
|
|
@ -4,8 +4,8 @@ import (
|
||||||
"net/http"
|
"net/http"
|
||||||
"time"
|
"time"
|
||||||
|
|
||||||
"git.fireandbrimst.one/aw/go-chart"
|
"github.com/wcharczuk/go-chart"
|
||||||
"git.fireandbrimst.one/aw/go-chart/drawing"
|
"github.com/wcharczuk/go-chart/drawing"
|
||||||
)
|
)
|
||||||
|
|
||||||
func drawChart(res http.ResponseWriter, req *http.Request) {
|
func drawChart(res http.ResponseWriter, req *http.Request) {
|
||||||
|
|
@ -43,11 +43,11 @@ func drawChart(res http.ResponseWriter, req *http.Request) {
|
||||||
|
|
||||||
graph := chart.Chart{
|
graph := chart.Chart{
|
||||||
XAxis: chart.XAxis{
|
XAxis: chart.XAxis{
|
||||||
Style: chart.StyleShow(),
|
Style: chart.Style{Show: true},
|
||||||
TickPosition: chart.TickPositionBetweenTicks,
|
TickPosition: chart.TickPositionBetweenTicks,
|
||||||
},
|
},
|
||||||
YAxis: chart.YAxis{
|
YAxis: chart.YAxis{
|
||||||
Style: chart.StyleShow(),
|
Style: chart.Style{Show: true},
|
||||||
Range: &chart.ContinuousRange{
|
Range: &chart.ContinuousRange{
|
||||||
Max: 220.0,
|
Max: 220.0,
|
||||||
Min: 180.0,
|
Min: 180.0,
|
||||||
|
|
|
||||||
|
|
@ -3,8 +3,8 @@ package main
|
||||||
import (
|
import (
|
||||||
"net/http"
|
"net/http"
|
||||||
|
|
||||||
"git.fireandbrimst.one/aw/go-chart"
|
"github.com/wcharczuk/go-chart"
|
||||||
"git.fireandbrimst.one/aw/go-chart/drawing"
|
"github.com/wcharczuk/go-chart/drawing"
|
||||||
)
|
)
|
||||||
|
|
||||||
func drawChart(res http.ResponseWriter, req *http.Request) {
|
func drawChart(res http.ResponseWriter, req *http.Request) {
|
||||||
|
|
|
||||||
|
Before Width: | Height: | Size: 8.6 KiB |
|
|
@ -4,17 +4,19 @@ import (
|
||||||
"net/http"
|
"net/http"
|
||||||
"time"
|
"time"
|
||||||
|
|
||||||
"git.fireandbrimst.one/aw/go-chart"
|
"github.com/wcharczuk/go-chart"
|
||||||
)
|
)
|
||||||
|
|
||||||
func drawChart(res http.ResponseWriter, req *http.Request) {
|
func drawChart(res http.ResponseWriter, req *http.Request) {
|
||||||
/*
|
/*
|
||||||
This is an example of using the `TimeSeries` to automatically coerce time.Time values into a continuous xrange.
|
This is an example of using the `TimeSeries` to automatically coerce time.Time values into a continuous xrange.
|
||||||
Note: chart.TimeSeries implements `ValueFormatterProvider` and as a result gives the XAxis the appropriate formatter to use for the ticks.
|
Note: chart.TimeSeries implements `ValueFormatterProvider` and as a result gives the XAxis the appropariate formatter to use for the ticks.
|
||||||
*/
|
*/
|
||||||
graph := chart.Chart{
|
graph := chart.Chart{
|
||||||
XAxis: chart.XAxis{
|
XAxis: chart.XAxis{
|
||||||
Style: chart.StyleShow(),
|
Style: chart.Style{
|
||||||
|
Show: true,
|
||||||
|
},
|
||||||
},
|
},
|
||||||
Series: []chart.Series{
|
Series: []chart.Series{
|
||||||
chart.TimeSeries{
|
chart.TimeSeries{
|
||||||
|
|
@ -46,7 +48,9 @@ func drawCustomChart(res http.ResponseWriter, req *http.Request) {
|
||||||
*/
|
*/
|
||||||
graph := chart.Chart{
|
graph := chart.Chart{
|
||||||
XAxis: chart.XAxis{
|
XAxis: chart.XAxis{
|
||||||
Style: chart.StyleShow(),
|
Style: chart.Style{
|
||||||
|
Show: true,
|
||||||
|
},
|
||||||
ValueFormatter: chart.TimeHourValueFormatter,
|
ValueFormatter: chart.TimeHourValueFormatter,
|
||||||
},
|
},
|
||||||
Series: []chart.Series{
|
Series: []chart.Series{
|
||||||
|
|
@ -75,7 +79,7 @@ func drawCustomChart(res http.ResponseWriter, req *http.Request) {
|
||||||
|
|
||||||
func main() {
|
func main() {
|
||||||
http.HandleFunc("/", drawChart)
|
http.HandleFunc("/", drawChart)
|
||||||
http.HandleFunc("/favicon.ico", func(res http.ResponseWriter, req *http.Request) {
|
http.HandleFunc("/favico.ico", func(res http.ResponseWriter, req *http.Request) {
|
||||||
res.Write([]byte{})
|
res.Write([]byte{})
|
||||||
})
|
})
|
||||||
http.HandleFunc("/custom", drawCustomChart)
|
http.HandleFunc("/custom", drawCustomChart)
|
||||||
|
|
|
||||||
|
Before Width: | Height: | Size: 15 KiB After Width: | Height: | Size: 15 KiB |
|
|
@ -4,8 +4,7 @@ import (
|
||||||
"fmt"
|
"fmt"
|
||||||
"net/http"
|
"net/http"
|
||||||
|
|
||||||
"git.fireandbrimst.one/aw/go-chart"
|
"github.com/wcharczuk/go-chart"
|
||||||
util "git.fireandbrimst.one/aw/go-chart/util"
|
|
||||||
)
|
)
|
||||||
|
|
||||||
func drawChart(res http.ResponseWriter, req *http.Request) {
|
func drawChart(res http.ResponseWriter, req *http.Request) {
|
||||||
|
|
@ -18,19 +17,25 @@ func drawChart(res http.ResponseWriter, req *http.Request) {
|
||||||
|
|
||||||
graph := chart.Chart{
|
graph := chart.Chart{
|
||||||
XAxis: chart.XAxis{
|
XAxis: chart.XAxis{
|
||||||
Style: chart.StyleShow(), //enables / displays the x-axis
|
Style: chart.Style{
|
||||||
|
Show: true, //enables / displays the x-axis
|
||||||
|
},
|
||||||
TickPosition: chart.TickPositionBetweenTicks,
|
TickPosition: chart.TickPositionBetweenTicks,
|
||||||
ValueFormatter: func(v interface{}) string {
|
ValueFormatter: func(v interface{}) string {
|
||||||
typed := v.(float64)
|
typed := v.(float64)
|
||||||
typedDate := util.Time.FromFloat64(typed)
|
typedDate := chart.Time.FromFloat64(typed)
|
||||||
return fmt.Sprintf("%d-%d\n%d", typedDate.Month(), typedDate.Day(), typedDate.Year())
|
return fmt.Sprintf("%d-%d\n%d", typedDate.Month(), typedDate.Day(), typedDate.Year())
|
||||||
},
|
},
|
||||||
},
|
},
|
||||||
YAxis: chart.YAxis{
|
YAxis: chart.YAxis{
|
||||||
Style: chart.StyleShow(), //enables / displays the y-axis
|
Style: chart.Style{
|
||||||
|
Show: true, //enables / displays the y-axis
|
||||||
|
},
|
||||||
},
|
},
|
||||||
YAxisSecondary: chart.YAxis{
|
YAxisSecondary: chart.YAxis{
|
||||||
Style: chart.StyleShow(), //enables / displays the secondary y-axis
|
Style: chart.Style{
|
||||||
|
Show: true, //enables / displays the secondary y-axis
|
||||||
|
},
|
||||||
},
|
},
|
||||||
Series: []chart.Series{
|
Series: []chart.Series{
|
||||||
chart.ContinuousSeries{
|
chart.ContinuousSeries{
|
||||||
|
|
|
||||||
|
Before Width: | Height: | Size: 36 KiB After Width: | Height: | Size: 37 KiB |
|
|
@ -4,8 +4,8 @@ import (
|
||||||
"bytes"
|
"bytes"
|
||||||
"log"
|
"log"
|
||||||
"os"
|
"os"
|
||||||
|
//"time"
|
||||||
"git.fireandbrimst.one/aw/go-chart"
|
"github.com/wcharczuk/go-chart" //exposes "chart"
|
||||||
)
|
)
|
||||||
|
|
||||||
func main() {
|
func main() {
|
||||||
|
|
@ -14,8 +14,12 @@ func main() {
|
||||||
b = 1000
|
b = 1000
|
||||||
|
|
||||||
ts1 := chart.ContinuousSeries{ //TimeSeries{
|
ts1 := chart.ContinuousSeries{ //TimeSeries{
|
||||||
Name: "Time Series",
|
Name: "Time Series",
|
||||||
Style: chart.StyleShow(),
|
Style: chart.Style{
|
||||||
|
Show: true,
|
||||||
|
},
|
||||||
|
|
||||||
|
//XValues: []time.Time{time.Unix(3*b,0),time.Unix(4*b,0),time.Unix(5*b,0),time.Unix(6*b,0),time.Unix(7*b,0),time.Unix(8*b,0),time.Unix(9*b,0),time.Unix(10*b,0)},
|
||||||
XValues: []float64{10 * b, 20 * b, 30 * b, 40 * b, 50 * b, 60 * b, 70 * b, 80 * b},
|
XValues: []float64{10 * b, 20 * b, 30 * b, 40 * b, 50 * b, 60 * b, 70 * b, 80 * b},
|
||||||
YValues: []float64{1.0, 2.0, 30.0, 4.0, 50.0, 6.0, 7.0, 88.0},
|
YValues: []float64{1.0, 2.0, 30.0, 4.0, 50.0, 6.0, 7.0, 88.0},
|
||||||
}
|
}
|
||||||
|
|
|
||||||
|
|
@ -3,13 +3,6 @@ package chart
|
||||||
import (
|
import (
|
||||||
"fmt"
|
"fmt"
|
||||||
"math"
|
"math"
|
||||||
|
|
||||||
util "git.fireandbrimst.one/aw/go-chart/util"
|
|
||||||
)
|
|
||||||
|
|
||||||
// Interface Assertions.
|
|
||||||
var (
|
|
||||||
_ Series = (*AnnotationSeries)(nil)
|
|
||||||
)
|
)
|
||||||
|
|
||||||
// AnnotationSeries is a series of labels on the chart.
|
// AnnotationSeries is a series of labels on the chart.
|
||||||
|
|
@ -62,10 +55,10 @@ func (as AnnotationSeries) Measure(r Renderer, canvasBox Box, xrange, yrange Ran
|
||||||
lx := canvasBox.Left + xrange.Translate(a.XValue)
|
lx := canvasBox.Left + xrange.Translate(a.XValue)
|
||||||
ly := canvasBox.Bottom - yrange.Translate(a.YValue)
|
ly := canvasBox.Bottom - yrange.Translate(a.YValue)
|
||||||
ab := Draw.MeasureAnnotation(r, canvasBox, style, lx, ly, a.Label)
|
ab := Draw.MeasureAnnotation(r, canvasBox, style, lx, ly, a.Label)
|
||||||
box.Top = util.Math.MinInt(box.Top, ab.Top)
|
box.Top = Math.MinInt(box.Top, ab.Top)
|
||||||
box.Left = util.Math.MinInt(box.Left, ab.Left)
|
box.Left = Math.MinInt(box.Left, ab.Left)
|
||||||
box.Right = util.Math.MaxInt(box.Right, ab.Right)
|
box.Right = Math.MaxInt(box.Right, ab.Right)
|
||||||
box.Bottom = util.Math.MaxInt(box.Bottom, ab.Bottom)
|
box.Bottom = Math.MaxInt(box.Bottom, ab.Bottom)
|
||||||
}
|
}
|
||||||
}
|
}
|
||||||
return box
|
return box
|
||||||
|
|
|
||||||
119
annotation_series_test.go
Normal file
|
|
@ -0,0 +1,119 @@
|
||||||
|
package chart
|
||||||
|
|
||||||
|
import (
|
||||||
|
"image/color"
|
||||||
|
"testing"
|
||||||
|
|
||||||
|
"github.com/blendlabs/go-assert"
|
||||||
|
"github.com/wcharczuk/go-chart/drawing"
|
||||||
|
)
|
||||||
|
|
||||||
|
func TestAnnotationSeriesMeasure(t *testing.T) {
|
||||||
|
assert := assert.New(t)
|
||||||
|
|
||||||
|
as := AnnotationSeries{
|
||||||
|
Style: Style{
|
||||||
|
Show: true,
|
||||||
|
},
|
||||||
|
Annotations: []Value2{
|
||||||
|
{XValue: 1.0, YValue: 1.0, Label: "1.0"},
|
||||||
|
{XValue: 2.0, YValue: 2.0, Label: "2.0"},
|
||||||
|
{XValue: 3.0, YValue: 3.0, Label: "3.0"},
|
||||||
|
{XValue: 4.0, YValue: 4.0, Label: "4.0"},
|
||||||
|
},
|
||||||
|
}
|
||||||
|
|
||||||
|
r, err := PNG(110, 110)
|
||||||
|
assert.Nil(err)
|
||||||
|
|
||||||
|
f, err := GetDefaultFont()
|
||||||
|
assert.Nil(err)
|
||||||
|
|
||||||
|
xrange := &ContinuousRange{
|
||||||
|
Min: 1.0,
|
||||||
|
Max: 4.0,
|
||||||
|
Domain: 100,
|
||||||
|
}
|
||||||
|
yrange := &ContinuousRange{
|
||||||
|
Min: 1.0,
|
||||||
|
Max: 4.0,
|
||||||
|
Domain: 100,
|
||||||
|
}
|
||||||
|
|
||||||
|
cb := Box{
|
||||||
|
Top: 5,
|
||||||
|
Left: 5,
|
||||||
|
Right: 105,
|
||||||
|
Bottom: 105,
|
||||||
|
}
|
||||||
|
sd := Style{
|
||||||
|
FontSize: 10.0,
|
||||||
|
Font: f,
|
||||||
|
}
|
||||||
|
|
||||||
|
box := as.Measure(r, cb, xrange, yrange, sd)
|
||||||
|
assert.False(box.IsZero())
|
||||||
|
assert.Equal(-5.0, box.Top)
|
||||||
|
assert.Equal(5.0, box.Left)
|
||||||
|
assert.Equal(146.0, box.Right) //the top,left annotation sticks up 5px and out ~44px.
|
||||||
|
assert.Equal(115.0, box.Bottom)
|
||||||
|
}
|
||||||
|
|
||||||
|
func TestAnnotationSeriesRender(t *testing.T) {
|
||||||
|
assert := assert.New(t)
|
||||||
|
|
||||||
|
as := AnnotationSeries{
|
||||||
|
Style: Style{
|
||||||
|
Show: true,
|
||||||
|
FillColor: drawing.ColorWhite,
|
||||||
|
StrokeColor: drawing.ColorBlack,
|
||||||
|
},
|
||||||
|
Annotations: []Value2{
|
||||||
|
{XValue: 1.0, YValue: 1.0, Label: "1.0"},
|
||||||
|
{XValue: 2.0, YValue: 2.0, Label: "2.0"},
|
||||||
|
{XValue: 3.0, YValue: 3.0, Label: "3.0"},
|
||||||
|
{XValue: 4.0, YValue: 4.0, Label: "4.0"},
|
||||||
|
},
|
||||||
|
}
|
||||||
|
|
||||||
|
r, err := PNG(110, 110)
|
||||||
|
assert.Nil(err)
|
||||||
|
|
||||||
|
f, err := GetDefaultFont()
|
||||||
|
assert.Nil(err)
|
||||||
|
|
||||||
|
xrange := &ContinuousRange{
|
||||||
|
Min: 1.0,
|
||||||
|
Max: 4.0,
|
||||||
|
Domain: 100,
|
||||||
|
}
|
||||||
|
yrange := &ContinuousRange{
|
||||||
|
Min: 1.0,
|
||||||
|
Max: 4.0,
|
||||||
|
Domain: 100,
|
||||||
|
}
|
||||||
|
|
||||||
|
cb := Box{
|
||||||
|
Top: 5,
|
||||||
|
Left: 5,
|
||||||
|
Right: 105,
|
||||||
|
Bottom: 105,
|
||||||
|
}
|
||||||
|
sd := Style{
|
||||||
|
FontSize: 10.0,
|
||||||
|
Font: f,
|
||||||
|
}
|
||||||
|
|
||||||
|
as.Render(r, cb, xrange, yrange, sd)
|
||||||
|
|
||||||
|
rr, isRaster := r.(*rasterRenderer)
|
||||||
|
assert.True(isRaster)
|
||||||
|
assert.NotNil(rr)
|
||||||
|
|
||||||
|
c := rr.i.At(38, 70)
|
||||||
|
converted, isRGBA := color.RGBAModel.Convert(c).(color.RGBA)
|
||||||
|
assert.True(isRGBA)
|
||||||
|
assert.Equal(0, converted.R)
|
||||||
|
assert.Equal(0, converted.G)
|
||||||
|
assert.Equal(0, converted.B)
|
||||||
|
}
|
||||||
90
bar_chart.go
|
|
@ -6,8 +6,7 @@ import (
|
||||||
"io"
|
"io"
|
||||||
"math"
|
"math"
|
||||||
|
|
||||||
util "git.fireandbrimst.one/aw/go-chart/util"
|
"github.com/golang/freetype/truetype"
|
||||||
"git.fireandbrimst.one/aw/golang-freetype/truetype"
|
|
||||||
)
|
)
|
||||||
|
|
||||||
// BarChart is a chart that draws bars on a range.
|
// BarChart is a chart that draws bars on a range.
|
||||||
|
|
@ -15,8 +14,6 @@ type BarChart struct {
|
||||||
Title string
|
Title string
|
||||||
TitleStyle Style
|
TitleStyle Style
|
||||||
|
|
||||||
ColorPalette ColorPalette
|
|
||||||
|
|
||||||
Width int
|
Width int
|
||||||
Height int
|
Height int
|
||||||
DPI float64
|
DPI float64
|
||||||
|
|
@ -31,9 +28,6 @@ type BarChart struct {
|
||||||
|
|
||||||
BarSpacing int
|
BarSpacing int
|
||||||
|
|
||||||
UseBaseValue bool
|
|
||||||
BaseValue float64
|
|
||||||
|
|
||||||
Font *truetype.Font
|
Font *truetype.Font
|
||||||
defaultFont *truetype.Font
|
defaultFont *truetype.Font
|
||||||
|
|
||||||
|
|
@ -129,7 +123,7 @@ func (bc BarChart) Render(rp RendererProvider, w io.Writer) error {
|
||||||
canvasBox = bc.getAdjustedCanvasBox(r, canvasBox, yr, yt)
|
canvasBox = bc.getAdjustedCanvasBox(r, canvasBox, yr, yt)
|
||||||
yr = bc.setRangeDomains(canvasBox, yr)
|
yr = bc.setRangeDomains(canvasBox, yr)
|
||||||
}
|
}
|
||||||
bc.drawCanvas(r, canvasBox)
|
|
||||||
bc.drawBars(r, canvasBox, yr)
|
bc.drawBars(r, canvasBox, yr)
|
||||||
bc.drawXAxis(r, canvasBox)
|
bc.drawXAxis(r, canvasBox)
|
||||||
bc.drawYAxis(r, canvasBox, yr, yt)
|
bc.drawYAxis(r, canvasBox, yr, yt)
|
||||||
|
|
@ -142,10 +136,6 @@ func (bc BarChart) Render(rp RendererProvider, w io.Writer) error {
|
||||||
return r.Save(w)
|
return r.Save(w)
|
||||||
}
|
}
|
||||||
|
|
||||||
func (bc BarChart) drawCanvas(r Renderer, canvasBox Box) {
|
|
||||||
Draw.Box(r, canvasBox, bc.getCanvasStyle())
|
|
||||||
}
|
|
||||||
|
|
||||||
func (bc BarChart) getRanges() Range {
|
func (bc BarChart) getRanges() Range {
|
||||||
var yrange Range
|
var yrange Range
|
||||||
if bc.YAxis.Range != nil && !bc.YAxis.Range.IsZero() {
|
if bc.YAxis.Range != nil && !bc.YAxis.Range.IsZero() {
|
||||||
|
|
@ -202,20 +192,11 @@ func (bc BarChart) drawBars(r Renderer, canvasBox Box, yr Range) {
|
||||||
|
|
||||||
by = canvasBox.Bottom - yr.Translate(bar.Value)
|
by = canvasBox.Bottom - yr.Translate(bar.Value)
|
||||||
|
|
||||||
if bc.UseBaseValue {
|
barBox = Box{
|
||||||
barBox = Box{
|
Top: by,
|
||||||
Top: by,
|
Left: bxl,
|
||||||
Left: bxl,
|
Right: bxr,
|
||||||
Right: bxr,
|
Bottom: canvasBox.Bottom,
|
||||||
Bottom: canvasBox.Bottom - yr.Translate(bc.BaseValue),
|
|
||||||
}
|
|
||||||
} else {
|
|
||||||
barBox = Box{
|
|
||||||
Top: by,
|
|
||||||
Left: bxl,
|
|
||||||
Right: bxr,
|
|
||||||
Bottom: canvasBox.Bottom,
|
|
||||||
}
|
|
||||||
}
|
}
|
||||||
|
|
||||||
Draw.Box(r, barBox, bar.Style.InheritFrom(bc.styleDefaultsBar(index)))
|
Draw.Box(r, barBox, bar.Style.InheritFrom(bc.styleDefaultsBar(index)))
|
||||||
|
|
@ -296,32 +277,7 @@ func (bc BarChart) drawYAxis(r Renderer, canvasBox Box, yr Range, ticks []Tick)
|
||||||
|
|
||||||
func (bc BarChart) drawTitle(r Renderer) {
|
func (bc BarChart) drawTitle(r Renderer) {
|
||||||
if len(bc.Title) > 0 && bc.TitleStyle.Show {
|
if len(bc.Title) > 0 && bc.TitleStyle.Show {
|
||||||
r.SetFont(bc.TitleStyle.GetFont(bc.GetFont()))
|
Draw.TextWithin(r, bc.Title, bc.box(), bc.styleDefaultsTitle())
|
||||||
r.SetFontColor(bc.TitleStyle.GetFontColor(bc.GetColorPalette().TextColor()))
|
|
||||||
titleFontSize := bc.TitleStyle.GetFontSize(bc.getTitleFontSize())
|
|
||||||
r.SetFontSize(titleFontSize)
|
|
||||||
|
|
||||||
textBox := r.MeasureText(bc.Title)
|
|
||||||
|
|
||||||
textWidth := textBox.Width()
|
|
||||||
textHeight := textBox.Height()
|
|
||||||
|
|
||||||
titleX := (bc.GetWidth() >> 1) - (textWidth >> 1)
|
|
||||||
titleY := bc.TitleStyle.Padding.GetTop(DefaultTitleTop) + textHeight
|
|
||||||
|
|
||||||
r.Text(bc.Title, titleX, titleY)
|
|
||||||
}
|
|
||||||
}
|
|
||||||
|
|
||||||
func (bc BarChart) getCanvasStyle() Style {
|
|
||||||
return bc.Canvas.InheritFrom(bc.styleDefaultsCanvas())
|
|
||||||
}
|
|
||||||
|
|
||||||
func (bc BarChart) styleDefaultsCanvas() Style {
|
|
||||||
return Style{
|
|
||||||
FillColor: bc.GetColorPalette().CanvasColor(),
|
|
||||||
StrokeColor: bc.GetColorPalette().CanvasStrokeColor(),
|
|
||||||
StrokeWidth: DefaultCanvasStrokeWidth,
|
|
||||||
}
|
}
|
||||||
}
|
}
|
||||||
|
|
||||||
|
|
@ -410,7 +366,7 @@ func (bc BarChart) getAdjustedCanvasBox(r Renderer, canvasBox Box, yrange Range,
|
||||||
lines := Text.WrapFit(r, bar.Label, barLabelBox.Width(), axisStyle)
|
lines := Text.WrapFit(r, bar.Label, barLabelBox.Width(), axisStyle)
|
||||||
linesBox := Text.MeasureLines(r, lines, axisStyle)
|
linesBox := Text.MeasureLines(r, lines, axisStyle)
|
||||||
|
|
||||||
xaxisHeight = util.Math.MinInt(linesBox.Height()+(2*DefaultXAxisMargin), xaxisHeight)
|
xaxisHeight = Math.MinInt(linesBox.Height()+(2*DefaultXAxisMargin), xaxisHeight)
|
||||||
}
|
}
|
||||||
}
|
}
|
||||||
|
|
||||||
|
|
@ -438,8 +394,8 @@ func (bc BarChart) box() Box {
|
||||||
dpb := bc.Background.Padding.GetBottom(50)
|
dpb := bc.Background.Padding.GetBottom(50)
|
||||||
|
|
||||||
return Box{
|
return Box{
|
||||||
Top: bc.Background.Padding.GetTop(20),
|
Top: 20,
|
||||||
Left: bc.Background.Padding.GetLeft(20),
|
Left: 20,
|
||||||
Right: bc.GetWidth() - dpr,
|
Right: bc.GetWidth() - dpr,
|
||||||
Bottom: bc.GetHeight() - dpb,
|
Bottom: bc.GetHeight() - dpb,
|
||||||
}
|
}
|
||||||
|
|
@ -451,23 +407,23 @@ func (bc BarChart) getBackgroundStyle() Style {
|
||||||
|
|
||||||
func (bc BarChart) styleDefaultsBackground() Style {
|
func (bc BarChart) styleDefaultsBackground() Style {
|
||||||
return Style{
|
return Style{
|
||||||
FillColor: bc.GetColorPalette().BackgroundColor(),
|
FillColor: DefaultBackgroundColor,
|
||||||
StrokeColor: bc.GetColorPalette().BackgroundStrokeColor(),
|
StrokeColor: DefaultBackgroundStrokeColor,
|
||||||
StrokeWidth: DefaultStrokeWidth,
|
StrokeWidth: DefaultStrokeWidth,
|
||||||
}
|
}
|
||||||
}
|
}
|
||||||
|
|
||||||
func (bc BarChart) styleDefaultsBar(index int) Style {
|
func (bc BarChart) styleDefaultsBar(index int) Style {
|
||||||
return Style{
|
return Style{
|
||||||
StrokeColor: bc.GetColorPalette().GetSeriesColor(index),
|
StrokeColor: GetAlternateColor(index),
|
||||||
StrokeWidth: 3.0,
|
StrokeWidth: 3.0,
|
||||||
FillColor: bc.GetColorPalette().GetSeriesColor(index),
|
FillColor: GetAlternateColor(index),
|
||||||
}
|
}
|
||||||
}
|
}
|
||||||
|
|
||||||
func (bc BarChart) styleDefaultsTitle() Style {
|
func (bc BarChart) styleDefaultsTitle() Style {
|
||||||
return bc.TitleStyle.InheritFrom(Style{
|
return bc.TitleStyle.InheritFrom(Style{
|
||||||
FontColor: bc.GetColorPalette().TextColor(),
|
FontColor: DefaultTextColor,
|
||||||
Font: bc.GetFont(),
|
Font: bc.GetFont(),
|
||||||
FontSize: bc.getTitleFontSize(),
|
FontSize: bc.getTitleFontSize(),
|
||||||
TextHorizontalAlign: TextHorizontalAlignCenter,
|
TextHorizontalAlign: TextHorizontalAlignCenter,
|
||||||
|
|
@ -477,7 +433,7 @@ func (bc BarChart) styleDefaultsTitle() Style {
|
||||||
}
|
}
|
||||||
|
|
||||||
func (bc BarChart) getTitleFontSize() float64 {
|
func (bc BarChart) getTitleFontSize() float64 {
|
||||||
effectiveDimension := util.Math.MinInt(bc.GetWidth(), bc.GetHeight())
|
effectiveDimension := Math.MinInt(bc.GetWidth(), bc.GetHeight())
|
||||||
if effectiveDimension >= 2048 {
|
if effectiveDimension >= 2048 {
|
||||||
return 48
|
return 48
|
||||||
} else if effectiveDimension >= 1024 {
|
} else if effectiveDimension >= 1024 {
|
||||||
|
|
@ -492,10 +448,10 @@ func (bc BarChart) getTitleFontSize() float64 {
|
||||||
|
|
||||||
func (bc BarChart) styleDefaultsAxes() Style {
|
func (bc BarChart) styleDefaultsAxes() Style {
|
||||||
return Style{
|
return Style{
|
||||||
StrokeColor: bc.GetColorPalette().AxisStrokeColor(),
|
StrokeColor: DefaultAxisColor,
|
||||||
Font: bc.GetFont(),
|
Font: bc.GetFont(),
|
||||||
FontSize: DefaultAxisFontSize,
|
FontSize: DefaultAxisFontSize,
|
||||||
FontColor: bc.GetColorPalette().TextColor(),
|
FontColor: DefaultAxisColor,
|
||||||
TextHorizontalAlign: TextHorizontalAlignCenter,
|
TextHorizontalAlign: TextHorizontalAlignCenter,
|
||||||
TextVerticalAlign: TextVerticalAlignTop,
|
TextVerticalAlign: TextVerticalAlignTop,
|
||||||
TextWrap: TextWrapWord,
|
TextWrap: TextWrapWord,
|
||||||
|
|
@ -507,11 +463,3 @@ func (bc BarChart) styleDefaultsElements() Style {
|
||||||
Font: bc.GetFont(),
|
Font: bc.GetFont(),
|
||||||
}
|
}
|
||||||
}
|
}
|
||||||
|
|
||||||
// GetColorPalette returns the color palette for the chart.
|
|
||||||
func (bc BarChart) GetColorPalette() ColorPalette {
|
|
||||||
if bc.ColorPalette != nil {
|
|
||||||
return bc.ColorPalette
|
|
||||||
}
|
|
||||||
return AlternateColorPalette
|
|
||||||
}
|
|
||||||
|
|
|
||||||
320
bar_chart_test.go
Normal file
|
|
@ -0,0 +1,320 @@
|
||||||
|
package chart
|
||||||
|
|
||||||
|
import (
|
||||||
|
"bytes"
|
||||||
|
"math"
|
||||||
|
"testing"
|
||||||
|
|
||||||
|
assert "github.com/blendlabs/go-assert"
|
||||||
|
)
|
||||||
|
|
||||||
|
func TestBarChartRender(t *testing.T) {
|
||||||
|
assert := assert.New(t)
|
||||||
|
|
||||||
|
bc := BarChart{
|
||||||
|
Width: 1024,
|
||||||
|
Title: "Test Title",
|
||||||
|
TitleStyle: StyleShow(),
|
||||||
|
XAxis: StyleShow(),
|
||||||
|
YAxis: YAxis{
|
||||||
|
Style: StyleShow(),
|
||||||
|
},
|
||||||
|
Bars: []Value{
|
||||||
|
{Value: 1.0, Label: "One"},
|
||||||
|
{Value: 2.0, Label: "Two"},
|
||||||
|
{Value: 3.0, Label: "Three"},
|
||||||
|
{Value: 4.0, Label: "Four"},
|
||||||
|
{Value: 5.0, Label: "Five"},
|
||||||
|
},
|
||||||
|
}
|
||||||
|
|
||||||
|
buf := bytes.NewBuffer([]byte{})
|
||||||
|
err := bc.Render(PNG, buf)
|
||||||
|
assert.Nil(err)
|
||||||
|
assert.NotZero(buf.Len())
|
||||||
|
}
|
||||||
|
|
||||||
|
func TestBarChartRenderZero(t *testing.T) {
|
||||||
|
assert := assert.New(t)
|
||||||
|
|
||||||
|
bc := BarChart{
|
||||||
|
Width: 1024,
|
||||||
|
Title: "Test Title",
|
||||||
|
TitleStyle: StyleShow(),
|
||||||
|
XAxis: StyleShow(),
|
||||||
|
YAxis: YAxis{
|
||||||
|
Style: StyleShow(),
|
||||||
|
},
|
||||||
|
Bars: []Value{
|
||||||
|
{Value: 0.0, Label: "One"},
|
||||||
|
{Value: 0.0, Label: "Two"},
|
||||||
|
},
|
||||||
|
}
|
||||||
|
|
||||||
|
buf := bytes.NewBuffer([]byte{})
|
||||||
|
err := bc.Render(PNG, buf)
|
||||||
|
assert.NotNil(err)
|
||||||
|
}
|
||||||
|
|
||||||
|
func TestBarChartProps(t *testing.T) {
|
||||||
|
assert := assert.New(t)
|
||||||
|
|
||||||
|
bc := BarChart{}
|
||||||
|
|
||||||
|
assert.Equal(DefaultDPI, bc.GetDPI())
|
||||||
|
bc.DPI = 100
|
||||||
|
assert.Equal(100, bc.GetDPI())
|
||||||
|
|
||||||
|
assert.Nil(bc.GetFont())
|
||||||
|
f, err := GetDefaultFont()
|
||||||
|
assert.Nil(err)
|
||||||
|
bc.Font = f
|
||||||
|
assert.NotNil(bc.GetFont())
|
||||||
|
|
||||||
|
assert.Equal(DefaultChartWidth, bc.GetWidth())
|
||||||
|
bc.Width = DefaultChartWidth - 1
|
||||||
|
assert.Equal(DefaultChartWidth-1, bc.GetWidth())
|
||||||
|
|
||||||
|
assert.Equal(DefaultChartHeight, bc.GetHeight())
|
||||||
|
bc.Height = DefaultChartHeight - 1
|
||||||
|
assert.Equal(DefaultChartHeight-1, bc.GetHeight())
|
||||||
|
|
||||||
|
assert.Equal(DefaultBarSpacing, bc.GetBarSpacing())
|
||||||
|
bc.BarSpacing = 150
|
||||||
|
assert.Equal(150, bc.GetBarSpacing())
|
||||||
|
|
||||||
|
assert.Equal(DefaultBarWidth, bc.GetBarWidth())
|
||||||
|
bc.BarWidth = 75
|
||||||
|
assert.Equal(75, bc.GetBarWidth())
|
||||||
|
}
|
||||||
|
|
||||||
|
func TestBarChartRenderNoBars(t *testing.T) {
|
||||||
|
assert := assert.New(t)
|
||||||
|
|
||||||
|
bc := BarChart{}
|
||||||
|
err := bc.Render(PNG, bytes.NewBuffer([]byte{}))
|
||||||
|
assert.NotNil(err)
|
||||||
|
}
|
||||||
|
|
||||||
|
func TestBarChartGetRanges(t *testing.T) {
|
||||||
|
assert := assert.New(t)
|
||||||
|
|
||||||
|
bc := BarChart{}
|
||||||
|
|
||||||
|
yr := bc.getRanges()
|
||||||
|
assert.NotNil(yr)
|
||||||
|
assert.False(yr.IsZero())
|
||||||
|
|
||||||
|
assert.Equal(-math.MaxFloat64, yr.GetMax())
|
||||||
|
assert.Equal(math.MaxFloat64, yr.GetMin())
|
||||||
|
}
|
||||||
|
|
||||||
|
func TestBarChartGetRangesBarsMinMax(t *testing.T) {
|
||||||
|
assert := assert.New(t)
|
||||||
|
|
||||||
|
bc := BarChart{
|
||||||
|
Bars: []Value{
|
||||||
|
{Value: 1.0},
|
||||||
|
{Value: 10.0},
|
||||||
|
},
|
||||||
|
}
|
||||||
|
|
||||||
|
yr := bc.getRanges()
|
||||||
|
assert.NotNil(yr)
|
||||||
|
assert.False(yr.IsZero())
|
||||||
|
|
||||||
|
assert.Equal(10, yr.GetMax())
|
||||||
|
assert.Equal(1, yr.GetMin())
|
||||||
|
}
|
||||||
|
|
||||||
|
func TestBarChartGetRangesMinMax(t *testing.T) {
|
||||||
|
assert := assert.New(t)
|
||||||
|
|
||||||
|
bc := BarChart{
|
||||||
|
YAxis: YAxis{
|
||||||
|
Range: &ContinuousRange{
|
||||||
|
Min: 5.0,
|
||||||
|
Max: 15.0,
|
||||||
|
},
|
||||||
|
Ticks: []Tick{
|
||||||
|
{Value: 7.0, Label: "Foo"},
|
||||||
|
{Value: 11.0, Label: "Foo2"},
|
||||||
|
},
|
||||||
|
},
|
||||||
|
Bars: []Value{
|
||||||
|
{Value: 1.0},
|
||||||
|
{Value: 10.0},
|
||||||
|
},
|
||||||
|
}
|
||||||
|
|
||||||
|
yr := bc.getRanges()
|
||||||
|
assert.NotNil(yr)
|
||||||
|
assert.False(yr.IsZero())
|
||||||
|
|
||||||
|
assert.Equal(15, yr.GetMax())
|
||||||
|
assert.Equal(5, yr.GetMin())
|
||||||
|
}
|
||||||
|
|
||||||
|
func TestBarChartGetRangesTicksMinMax(t *testing.T) {
|
||||||
|
assert := assert.New(t)
|
||||||
|
|
||||||
|
bc := BarChart{
|
||||||
|
YAxis: YAxis{
|
||||||
|
Ticks: []Tick{
|
||||||
|
{Value: 7.0, Label: "Foo"},
|
||||||
|
{Value: 11.0, Label: "Foo2"},
|
||||||
|
},
|
||||||
|
},
|
||||||
|
Bars: []Value{
|
||||||
|
{Value: 1.0},
|
||||||
|
{Value: 10.0},
|
||||||
|
},
|
||||||
|
}
|
||||||
|
|
||||||
|
yr := bc.getRanges()
|
||||||
|
assert.NotNil(yr)
|
||||||
|
assert.False(yr.IsZero())
|
||||||
|
|
||||||
|
assert.Equal(11, yr.GetMax())
|
||||||
|
assert.Equal(7, yr.GetMin())
|
||||||
|
}
|
||||||
|
|
||||||
|
func TestBarChartHasAxes(t *testing.T) {
|
||||||
|
assert := assert.New(t)
|
||||||
|
|
||||||
|
bc := BarChart{}
|
||||||
|
assert.False(bc.hasAxes())
|
||||||
|
bc.YAxis = YAxis{
|
||||||
|
Style: StyleShow(),
|
||||||
|
}
|
||||||
|
|
||||||
|
assert.True(bc.hasAxes())
|
||||||
|
}
|
||||||
|
|
||||||
|
func TestBarChartGetDefaultCanvasBox(t *testing.T) {
|
||||||
|
assert := assert.New(t)
|
||||||
|
|
||||||
|
bc := BarChart{}
|
||||||
|
b := bc.getDefaultCanvasBox()
|
||||||
|
assert.False(b.IsZero())
|
||||||
|
}
|
||||||
|
|
||||||
|
func TestBarChartSetRangeDomains(t *testing.T) {
|
||||||
|
assert := assert.New(t)
|
||||||
|
|
||||||
|
bc := BarChart{}
|
||||||
|
cb := bc.box()
|
||||||
|
yr := bc.getRanges()
|
||||||
|
yr2 := bc.setRangeDomains(cb, yr)
|
||||||
|
assert.NotZero(yr2.GetDomain())
|
||||||
|
}
|
||||||
|
|
||||||
|
func TestBarChartGetValueFormatters(t *testing.T) {
|
||||||
|
assert := assert.New(t)
|
||||||
|
|
||||||
|
bc := BarChart{}
|
||||||
|
vf := bc.getValueFormatters()
|
||||||
|
assert.NotNil(vf)
|
||||||
|
assert.Equal("1234.00", vf(1234.0))
|
||||||
|
|
||||||
|
bc.YAxis.ValueFormatter = func(_ interface{}) string { return "test" }
|
||||||
|
assert.Equal("test", bc.getValueFormatters()(1234))
|
||||||
|
}
|
||||||
|
|
||||||
|
func TestBarChartGetAxesTicks(t *testing.T) {
|
||||||
|
assert := assert.New(t)
|
||||||
|
|
||||||
|
bc := BarChart{
|
||||||
|
Bars: []Value{
|
||||||
|
{Value: 1.0},
|
||||||
|
{Value: 2.0},
|
||||||
|
{Value: 3.0},
|
||||||
|
},
|
||||||
|
}
|
||||||
|
|
||||||
|
r, err := PNG(128, 128)
|
||||||
|
assert.Nil(err)
|
||||||
|
yr := bc.getRanges()
|
||||||
|
yf := bc.getValueFormatters()
|
||||||
|
|
||||||
|
ticks := bc.getAxesTicks(r, yr, yf)
|
||||||
|
assert.Empty(ticks)
|
||||||
|
|
||||||
|
bc.YAxis.Style.Show = true
|
||||||
|
ticks = bc.getAxesTicks(r, yr, yf)
|
||||||
|
assert.Len(ticks, 2)
|
||||||
|
}
|
||||||
|
|
||||||
|
func TestBarChartCalculateEffectiveBarSpacing(t *testing.T) {
|
||||||
|
assert := assert.New(t)
|
||||||
|
|
||||||
|
bc := BarChart{
|
||||||
|
Width: 1024,
|
||||||
|
BarWidth: 10,
|
||||||
|
Bars: []Value{
|
||||||
|
{Value: 1.0, Label: "One"},
|
||||||
|
{Value: 2.0, Label: "Two"},
|
||||||
|
{Value: 3.0, Label: "Three"},
|
||||||
|
{Value: 4.0, Label: "Four"},
|
||||||
|
{Value: 5.0, Label: "Five"},
|
||||||
|
},
|
||||||
|
}
|
||||||
|
|
||||||
|
spacing := bc.calculateEffectiveBarSpacing(bc.box())
|
||||||
|
assert.NotZero(spacing)
|
||||||
|
|
||||||
|
bc.BarWidth = 250
|
||||||
|
spacing = bc.calculateEffectiveBarSpacing(bc.box())
|
||||||
|
assert.Zero(spacing)
|
||||||
|
}
|
||||||
|
|
||||||
|
func TestBarChartCalculateEffectiveBarWidth(t *testing.T) {
|
||||||
|
assert := assert.New(t)
|
||||||
|
|
||||||
|
bc := BarChart{
|
||||||
|
Width: 1024,
|
||||||
|
BarWidth: 10,
|
||||||
|
Bars: []Value{
|
||||||
|
{Value: 1.0, Label: "One"},
|
||||||
|
{Value: 2.0, Label: "Two"},
|
||||||
|
{Value: 3.0, Label: "Three"},
|
||||||
|
{Value: 4.0, Label: "Four"},
|
||||||
|
{Value: 5.0, Label: "Five"},
|
||||||
|
},
|
||||||
|
}
|
||||||
|
|
||||||
|
cb := bc.box()
|
||||||
|
|
||||||
|
spacing := bc.calculateEffectiveBarSpacing(bc.box())
|
||||||
|
assert.NotZero(spacing)
|
||||||
|
|
||||||
|
barWidth := bc.calculateEffectiveBarWidth(bc.box(), spacing)
|
||||||
|
assert.Equal(10, barWidth)
|
||||||
|
|
||||||
|
bc.BarWidth = 250
|
||||||
|
spacing = bc.calculateEffectiveBarSpacing(bc.box())
|
||||||
|
assert.Zero(spacing)
|
||||||
|
barWidth = bc.calculateEffectiveBarWidth(bc.box(), spacing)
|
||||||
|
assert.Equal(199, barWidth)
|
||||||
|
|
||||||
|
assert.Equal(cb.Width()+1, bc.calculateTotalBarWidth(barWidth, spacing))
|
||||||
|
|
||||||
|
bw, bs, total := bc.calculateScaledTotalWidth(cb)
|
||||||
|
assert.Equal(spacing, bs)
|
||||||
|
assert.Equal(barWidth, bw)
|
||||||
|
assert.Equal(cb.Width()+1, total)
|
||||||
|
}
|
||||||
|
|
||||||
|
func TestBarChatGetTitleFontSize(t *testing.T) {
|
||||||
|
assert := assert.New(t)
|
||||||
|
size := BarChart{Width: 2049, Height: 2049}.getTitleFontSize()
|
||||||
|
assert.Equal(48, size)
|
||||||
|
size = BarChart{Width: 1025, Height: 1025}.getTitleFontSize()
|
||||||
|
assert.Equal(24, size)
|
||||||
|
size = BarChart{Width: 513, Height: 513}.getTitleFontSize()
|
||||||
|
assert.Equal(18, size)
|
||||||
|
size = BarChart{Width: 257, Height: 257}.getTitleFontSize()
|
||||||
|
assert.Equal(12, size)
|
||||||
|
size = BarChart{Width: 128, Height: 128}.getTitleFontSize()
|
||||||
|
assert.Equal(10, size)
|
||||||
|
}
|
||||||
|
|
@ -2,13 +2,7 @@ package chart
|
||||||
|
|
||||||
import (
|
import (
|
||||||
"fmt"
|
"fmt"
|
||||||
|
"math"
|
||||||
"git.fireandbrimst.one/aw/go-chart/seq"
|
|
||||||
)
|
|
||||||
|
|
||||||
// Interface Assertions.
|
|
||||||
var (
|
|
||||||
_ Series = (*BollingerBandsSeries)(nil)
|
|
||||||
)
|
)
|
||||||
|
|
||||||
// BollingerBandsSeries draws bollinger bands for an inner series.
|
// BollingerBandsSeries draws bollinger bands for an inner series.
|
||||||
|
|
@ -20,9 +14,9 @@ type BollingerBandsSeries struct {
|
||||||
|
|
||||||
Period int
|
Period int
|
||||||
K float64
|
K float64
|
||||||
InnerSeries ValuesProvider
|
InnerSeries ValueProvider
|
||||||
|
|
||||||
valueBuffer *seq.Buffer
|
valueBuffer *RingBuffer
|
||||||
}
|
}
|
||||||
|
|
||||||
// GetName returns the name of the time series.
|
// GetName returns the name of the time series.
|
||||||
|
|
@ -48,9 +42,7 @@ func (bbs BollingerBandsSeries) GetPeriod() int {
|
||||||
return bbs.Period
|
return bbs.Period
|
||||||
}
|
}
|
||||||
|
|
||||||
// GetK returns the K value, or the number of standard deviations above and below
|
// GetK returns the K value.
|
||||||
// to band the simple moving average with.
|
|
||||||
// Typical K value is 2.0.
|
|
||||||
func (bbs BollingerBandsSeries) GetK(defaults ...float64) float64 {
|
func (bbs BollingerBandsSeries) GetK(defaults ...float64) float64 {
|
||||||
if bbs.K == 0 {
|
if bbs.K == 0 {
|
||||||
if len(defaults) > 0 {
|
if len(defaults) > 0 {
|
||||||
|
|
@ -62,35 +54,35 @@ func (bbs BollingerBandsSeries) GetK(defaults ...float64) float64 {
|
||||||
}
|
}
|
||||||
|
|
||||||
// Len returns the number of elements in the series.
|
// Len returns the number of elements in the series.
|
||||||
func (bbs BollingerBandsSeries) Len() int {
|
func (bbs *BollingerBandsSeries) Len() int {
|
||||||
return bbs.InnerSeries.Len()
|
return bbs.InnerSeries.Len()
|
||||||
}
|
}
|
||||||
|
|
||||||
// GetBoundedValues gets the bounded value for the series.
|
// GetBoundedValue gets the bounded value for the series.
|
||||||
func (bbs *BollingerBandsSeries) GetBoundedValues(index int) (x, y1, y2 float64) {
|
func (bbs *BollingerBandsSeries) GetBoundedValue(index int) (x, y1, y2 float64) {
|
||||||
if bbs.InnerSeries == nil {
|
if bbs.InnerSeries == nil {
|
||||||
return
|
return
|
||||||
}
|
}
|
||||||
if bbs.valueBuffer == nil || index == 0 {
|
if bbs.valueBuffer == nil || index == 0 {
|
||||||
bbs.valueBuffer = seq.NewBufferWithCapacity(bbs.GetPeriod())
|
bbs.valueBuffer = NewRingBufferWithCapacity(bbs.GetPeriod())
|
||||||
}
|
}
|
||||||
if bbs.valueBuffer.Len() >= bbs.GetPeriod() {
|
if bbs.valueBuffer.Len() >= bbs.GetPeriod() {
|
||||||
bbs.valueBuffer.Dequeue()
|
bbs.valueBuffer.Dequeue()
|
||||||
}
|
}
|
||||||
px, py := bbs.InnerSeries.GetValues(index)
|
px, py := bbs.InnerSeries.GetValue(index)
|
||||||
bbs.valueBuffer.Enqueue(py)
|
bbs.valueBuffer.Enqueue(py)
|
||||||
x = px
|
x = px
|
||||||
|
|
||||||
ay := seq.New(bbs.valueBuffer).Average()
|
ay := bbs.getAverage(bbs.valueBuffer)
|
||||||
std := seq.New(bbs.valueBuffer).StdDev()
|
std := bbs.getStdDev(bbs.valueBuffer)
|
||||||
|
|
||||||
y1 = ay + (bbs.GetK() * std)
|
y1 = ay + (bbs.GetK() * std)
|
||||||
y2 = ay - (bbs.GetK() * std)
|
y2 = ay - (bbs.GetK() * std)
|
||||||
return
|
return
|
||||||
}
|
}
|
||||||
|
|
||||||
// GetBoundedLastValues returns the last bounded value for the series.
|
// GetBoundedLastValue returns the last bounded value for the series.
|
||||||
func (bbs *BollingerBandsSeries) GetBoundedLastValues() (x, y1, y2 float64) {
|
func (bbs *BollingerBandsSeries) GetBoundedLastValue() (x, y1, y2 float64) {
|
||||||
if bbs.InnerSeries == nil {
|
if bbs.InnerSeries == nil {
|
||||||
return
|
return
|
||||||
}
|
}
|
||||||
|
|
@ -101,15 +93,15 @@ func (bbs *BollingerBandsSeries) GetBoundedLastValues() (x, y1, y2 float64) {
|
||||||
startAt = 0
|
startAt = 0
|
||||||
}
|
}
|
||||||
|
|
||||||
vb := seq.NewBufferWithCapacity(period)
|
vb := NewRingBufferWithCapacity(period)
|
||||||
for index := startAt; index < seriesLength; index++ {
|
for index := startAt; index < seriesLength; index++ {
|
||||||
xn, yn := bbs.InnerSeries.GetValues(index)
|
xn, yn := bbs.InnerSeries.GetValue(index)
|
||||||
vb.Enqueue(yn)
|
vb.Enqueue(yn)
|
||||||
x = xn
|
x = xn
|
||||||
}
|
}
|
||||||
|
|
||||||
ay := seq.Seq{Provider: vb}.Average()
|
ay := bbs.getAverage(vb)
|
||||||
std := seq.Seq{Provider: vb}.StdDev()
|
std := bbs.getStdDev(vb)
|
||||||
|
|
||||||
y1 = ay + (bbs.GetK() * std)
|
y1 = ay + (bbs.GetK() * std)
|
||||||
y2 = ay - (bbs.GetK() * std)
|
y2 = ay - (bbs.GetK() * std)
|
||||||
|
|
@ -128,6 +120,37 @@ func (bbs *BollingerBandsSeries) Render(r Renderer, canvasBox Box, xrange, yrang
|
||||||
Draw.BoundedSeries(r, canvasBox, xrange, yrange, s, bbs, bbs.GetPeriod())
|
Draw.BoundedSeries(r, canvasBox, xrange, yrange, s, bbs, bbs.GetPeriod())
|
||||||
}
|
}
|
||||||
|
|
||||||
|
func (bbs BollingerBandsSeries) getAverage(valueBuffer *RingBuffer) float64 {
|
||||||
|
var accum float64
|
||||||
|
valueBuffer.Each(func(v interface{}) {
|
||||||
|
if typed, isTyped := v.(float64); isTyped {
|
||||||
|
accum += typed
|
||||||
|
}
|
||||||
|
})
|
||||||
|
return accum / float64(valueBuffer.Len())
|
||||||
|
}
|
||||||
|
|
||||||
|
func (bbs BollingerBandsSeries) getVariance(valueBuffer *RingBuffer) float64 {
|
||||||
|
if valueBuffer.Len() == 0 {
|
||||||
|
return 0
|
||||||
|
}
|
||||||
|
|
||||||
|
var variance float64
|
||||||
|
m := bbs.getAverage(valueBuffer)
|
||||||
|
|
||||||
|
valueBuffer.Each(func(v interface{}) {
|
||||||
|
if n, isTyped := v.(float64); isTyped {
|
||||||
|
variance += (float64(n) - m) * (float64(n) - m)
|
||||||
|
}
|
||||||
|
})
|
||||||
|
|
||||||
|
return variance / float64(valueBuffer.Len())
|
||||||
|
}
|
||||||
|
|
||||||
|
func (bbs BollingerBandsSeries) getStdDev(valueBuffer *RingBuffer) float64 {
|
||||||
|
return math.Pow(bbs.getVariance(valueBuffer), 0.5)
|
||||||
|
}
|
||||||
|
|
||||||
// Validate validates the series.
|
// Validate validates the series.
|
||||||
func (bbs BollingerBandsSeries) Validate() error {
|
func (bbs BollingerBandsSeries) Validate() error {
|
||||||
if bbs.InnerSeries == nil {
|
if bbs.InnerSeries == nil {
|
||||||
|
|
|
||||||
51
bollinger_band_series_test.go
Normal file
|
|
@ -0,0 +1,51 @@
|
||||||
|
package chart
|
||||||
|
|
||||||
|
import (
|
||||||
|
"math"
|
||||||
|
"testing"
|
||||||
|
|
||||||
|
"github.com/blendlabs/go-assert"
|
||||||
|
)
|
||||||
|
|
||||||
|
func TestBollingerBandSeries(t *testing.T) {
|
||||||
|
assert := assert.New(t)
|
||||||
|
|
||||||
|
s1 := mockValueProvider{
|
||||||
|
X: Sequence.Float64(1.0, 100.0),
|
||||||
|
Y: Sequence.Random(100, 1024),
|
||||||
|
}
|
||||||
|
|
||||||
|
bbs := &BollingerBandsSeries{
|
||||||
|
InnerSeries: s1,
|
||||||
|
}
|
||||||
|
|
||||||
|
xvalues := make([]float64, 100)
|
||||||
|
y1values := make([]float64, 100)
|
||||||
|
y2values := make([]float64, 100)
|
||||||
|
|
||||||
|
for x := 0; x < 100; x++ {
|
||||||
|
xvalues[x], y1values[x], y2values[x] = bbs.GetBoundedValue(x)
|
||||||
|
}
|
||||||
|
|
||||||
|
for x := bbs.GetPeriod(); x < 100; x++ {
|
||||||
|
assert.True(y1values[x] > y2values[x])
|
||||||
|
}
|
||||||
|
}
|
||||||
|
|
||||||
|
func TestBollingerBandLastValue(t *testing.T) {
|
||||||
|
assert := assert.New(t)
|
||||||
|
|
||||||
|
s1 := mockValueProvider{
|
||||||
|
X: Sequence.Float64(1.0, 100.0),
|
||||||
|
Y: Sequence.Float64(1.0, 100.0),
|
||||||
|
}
|
||||||
|
|
||||||
|
bbs := &BollingerBandsSeries{
|
||||||
|
InnerSeries: s1,
|
||||||
|
}
|
||||||
|
|
||||||
|
x, y1, y2 := bbs.GetBoundedLastValue()
|
||||||
|
assert.Equal(100.0, x)
|
||||||
|
assert.Equal(101, math.Floor(y1))
|
||||||
|
assert.Equal(83, math.Floor(y2))
|
||||||
|
}
|
||||||
56
box.go
|
|
@ -3,8 +3,6 @@ package chart
|
||||||
import (
|
import (
|
||||||
"fmt"
|
"fmt"
|
||||||
"math"
|
"math"
|
||||||
|
|
||||||
util "git.fireandbrimst.one/aw/go-chart/util"
|
|
||||||
)
|
)
|
||||||
|
|
||||||
var (
|
var (
|
||||||
|
|
@ -91,12 +89,12 @@ func (b Box) GetBottom(defaults ...int) int {
|
||||||
|
|
||||||
// Width returns the width
|
// Width returns the width
|
||||||
func (b Box) Width() int {
|
func (b Box) Width() int {
|
||||||
return util.Math.AbsInt(b.Right - b.Left)
|
return Math.AbsInt(b.Right - b.Left)
|
||||||
}
|
}
|
||||||
|
|
||||||
// Height returns the height
|
// Height returns the height
|
||||||
func (b Box) Height() int {
|
func (b Box) Height() int {
|
||||||
return util.Math.AbsInt(b.Bottom - b.Top)
|
return Math.AbsInt(b.Bottom - b.Top)
|
||||||
}
|
}
|
||||||
|
|
||||||
// Center returns the center of the box
|
// Center returns the center of the box
|
||||||
|
|
@ -148,10 +146,10 @@ func (b Box) Equals(other Box) bool {
|
||||||
// Grow grows a box based on another box.
|
// Grow grows a box based on another box.
|
||||||
func (b Box) Grow(other Box) Box {
|
func (b Box) Grow(other Box) Box {
|
||||||
return Box{
|
return Box{
|
||||||
Top: util.Math.MinInt(b.Top, other.Top),
|
Top: Math.MinInt(b.Top, other.Top),
|
||||||
Left: util.Math.MinInt(b.Left, other.Left),
|
Left: Math.MinInt(b.Left, other.Left),
|
||||||
Right: util.Math.MaxInt(b.Right, other.Right),
|
Right: Math.MaxInt(b.Right, other.Right),
|
||||||
Bottom: util.Math.MaxInt(b.Bottom, other.Bottom),
|
Bottom: Math.MaxInt(b.Bottom, other.Bottom),
|
||||||
}
|
}
|
||||||
}
|
}
|
||||||
|
|
||||||
|
|
@ -222,10 +220,10 @@ func (b Box) Fit(other Box) Box {
|
||||||
func (b Box) Constrain(other Box) Box {
|
func (b Box) Constrain(other Box) Box {
|
||||||
newBox := b.Clone()
|
newBox := b.Clone()
|
||||||
|
|
||||||
newBox.Top = util.Math.MaxInt(newBox.Top, other.Top)
|
newBox.Top = Math.MaxInt(newBox.Top, other.Top)
|
||||||
newBox.Left = util.Math.MaxInt(newBox.Left, other.Left)
|
newBox.Left = Math.MaxInt(newBox.Left, other.Left)
|
||||||
newBox.Right = util.Math.MinInt(newBox.Right, other.Right)
|
newBox.Right = Math.MinInt(newBox.Right, other.Right)
|
||||||
newBox.Bottom = util.Math.MinInt(newBox.Bottom, other.Bottom)
|
newBox.Bottom = Math.MinInt(newBox.Bottom, other.Bottom)
|
||||||
|
|
||||||
return newBox
|
return newBox
|
||||||
}
|
}
|
||||||
|
|
@ -264,36 +262,36 @@ type BoxCorners struct {
|
||||||
// Box return the BoxCorners as a regular box.
|
// Box return the BoxCorners as a regular box.
|
||||||
func (bc BoxCorners) Box() Box {
|
func (bc BoxCorners) Box() Box {
|
||||||
return Box{
|
return Box{
|
||||||
Top: util.Math.MinInt(bc.TopLeft.Y, bc.TopRight.Y),
|
Top: Math.MinInt(bc.TopLeft.Y, bc.TopRight.Y),
|
||||||
Left: util.Math.MinInt(bc.TopLeft.X, bc.BottomLeft.X),
|
Left: Math.MinInt(bc.TopLeft.X, bc.BottomLeft.X),
|
||||||
Right: util.Math.MaxInt(bc.TopRight.X, bc.BottomRight.X),
|
Right: Math.MaxInt(bc.TopRight.X, bc.BottomRight.X),
|
||||||
Bottom: util.Math.MaxInt(bc.BottomLeft.Y, bc.BottomRight.Y),
|
Bottom: Math.MaxInt(bc.BottomLeft.Y, bc.BottomRight.Y),
|
||||||
}
|
}
|
||||||
}
|
}
|
||||||
|
|
||||||
// Width returns the width
|
// Width returns the width
|
||||||
func (bc BoxCorners) Width() int {
|
func (bc BoxCorners) Width() int {
|
||||||
minLeft := util.Math.MinInt(bc.TopLeft.X, bc.BottomLeft.X)
|
minLeft := Math.MinInt(bc.TopLeft.X, bc.BottomLeft.X)
|
||||||
maxRight := util.Math.MaxInt(bc.TopRight.X, bc.BottomRight.X)
|
maxRight := Math.MaxInt(bc.TopRight.X, bc.BottomRight.X)
|
||||||
return maxRight - minLeft
|
return maxRight - minLeft
|
||||||
}
|
}
|
||||||
|
|
||||||
// Height returns the height
|
// Height returns the height
|
||||||
func (bc BoxCorners) Height() int {
|
func (bc BoxCorners) Height() int {
|
||||||
minTop := util.Math.MinInt(bc.TopLeft.Y, bc.TopRight.Y)
|
minTop := Math.MinInt(bc.TopLeft.Y, bc.TopRight.Y)
|
||||||
maxBottom := util.Math.MaxInt(bc.BottomLeft.Y, bc.BottomRight.Y)
|
maxBottom := Math.MaxInt(bc.BottomLeft.Y, bc.BottomRight.Y)
|
||||||
return maxBottom - minTop
|
return maxBottom - minTop
|
||||||
}
|
}
|
||||||
|
|
||||||
// Center returns the center of the box
|
// Center returns the center of the box
|
||||||
func (bc BoxCorners) Center() (x, y int) {
|
func (bc BoxCorners) Center() (x, y int) {
|
||||||
|
|
||||||
left := util.Math.MeanInt(bc.TopLeft.X, bc.BottomLeft.X)
|
left := Math.MeanInt(bc.TopLeft.X, bc.BottomLeft.X)
|
||||||
right := util.Math.MeanInt(bc.TopRight.X, bc.BottomRight.X)
|
right := Math.MeanInt(bc.TopRight.X, bc.BottomRight.X)
|
||||||
x = ((right - left) >> 1) + left
|
x = ((right - left) >> 1) + left
|
||||||
|
|
||||||
top := util.Math.MeanInt(bc.TopLeft.Y, bc.TopRight.Y)
|
top := Math.MeanInt(bc.TopLeft.Y, bc.TopRight.Y)
|
||||||
bottom := util.Math.MeanInt(bc.BottomLeft.Y, bc.BottomRight.Y)
|
bottom := Math.MeanInt(bc.BottomLeft.Y, bc.BottomRight.Y)
|
||||||
y = ((bottom - top) >> 1) + top
|
y = ((bottom - top) >> 1) + top
|
||||||
|
|
||||||
return
|
return
|
||||||
|
|
@ -303,12 +301,12 @@ func (bc BoxCorners) Center() (x, y int) {
|
||||||
func (bc BoxCorners) Rotate(thetaDegrees float64) BoxCorners {
|
func (bc BoxCorners) Rotate(thetaDegrees float64) BoxCorners {
|
||||||
cx, cy := bc.Center()
|
cx, cy := bc.Center()
|
||||||
|
|
||||||
thetaRadians := util.Math.DegreesToRadians(thetaDegrees)
|
thetaRadians := Math.DegreesToRadians(thetaDegrees)
|
||||||
|
|
||||||
tlx, tly := util.Math.RotateCoordinate(cx, cy, bc.TopLeft.X, bc.TopLeft.Y, thetaRadians)
|
tlx, tly := Math.RotateCoordinate(cx, cy, bc.TopLeft.X, bc.TopLeft.Y, thetaRadians)
|
||||||
trx, try := util.Math.RotateCoordinate(cx, cy, bc.TopRight.X, bc.TopRight.Y, thetaRadians)
|
trx, try := Math.RotateCoordinate(cx, cy, bc.TopRight.X, bc.TopRight.Y, thetaRadians)
|
||||||
brx, bry := util.Math.RotateCoordinate(cx, cy, bc.BottomRight.X, bc.BottomRight.Y, thetaRadians)
|
brx, bry := Math.RotateCoordinate(cx, cy, bc.BottomRight.X, bc.BottomRight.Y, thetaRadians)
|
||||||
blx, bly := util.Math.RotateCoordinate(cx, cy, bc.BottomLeft.X, bc.BottomLeft.Y, thetaRadians)
|
blx, bly := Math.RotateCoordinate(cx, cy, bc.BottomLeft.X, bc.BottomLeft.Y, thetaRadians)
|
||||||
|
|
||||||
return BoxCorners{
|
return BoxCorners{
|
||||||
TopLeft: Point{tlx, tly},
|
TopLeft: Point{tlx, tly},
|
||||||
|
|
|
||||||
188
box_test.go
Normal file
|
|
@ -0,0 +1,188 @@
|
||||||
|
package chart
|
||||||
|
|
||||||
|
import (
|
||||||
|
"math"
|
||||||
|
"testing"
|
||||||
|
|
||||||
|
"github.com/blendlabs/go-assert"
|
||||||
|
)
|
||||||
|
|
||||||
|
func TestBoxClone(t *testing.T) {
|
||||||
|
assert := assert.New(t)
|
||||||
|
a := Box{Top: 5, Left: 5, Right: 15, Bottom: 15}
|
||||||
|
b := a.Clone()
|
||||||
|
assert.True(a.Equals(b))
|
||||||
|
assert.True(b.Equals(a))
|
||||||
|
}
|
||||||
|
|
||||||
|
func TestBoxEquals(t *testing.T) {
|
||||||
|
assert := assert.New(t)
|
||||||
|
|
||||||
|
a := Box{Top: 5, Left: 5, Right: 15, Bottom: 15}
|
||||||
|
b := Box{Top: 10, Left: 10, Right: 30, Bottom: 30}
|
||||||
|
c := Box{Top: 5, Left: 5, Right: 15, Bottom: 15}
|
||||||
|
assert.True(a.Equals(a))
|
||||||
|
assert.True(a.Equals(c))
|
||||||
|
assert.True(c.Equals(a))
|
||||||
|
assert.False(a.Equals(b))
|
||||||
|
assert.False(c.Equals(b))
|
||||||
|
assert.False(b.Equals(a))
|
||||||
|
assert.False(b.Equals(c))
|
||||||
|
}
|
||||||
|
|
||||||
|
func TestBoxIsBiggerThan(t *testing.T) {
|
||||||
|
assert := assert.New(t)
|
||||||
|
|
||||||
|
a := Box{Top: 5, Left: 5, Right: 25, Bottom: 25}
|
||||||
|
b := Box{Top: 10, Left: 10, Right: 20, Bottom: 20} // only half bigger
|
||||||
|
c := Box{Top: 1, Left: 1, Right: 30, Bottom: 30} //bigger
|
||||||
|
assert.True(a.IsBiggerThan(b))
|
||||||
|
assert.False(a.IsBiggerThan(c))
|
||||||
|
assert.True(c.IsBiggerThan(a))
|
||||||
|
}
|
||||||
|
|
||||||
|
func TestBoxIsSmallerThan(t *testing.T) {
|
||||||
|
assert := assert.New(t)
|
||||||
|
|
||||||
|
a := Box{Top: 5, Left: 5, Right: 25, Bottom: 25}
|
||||||
|
b := Box{Top: 10, Left: 10, Right: 20, Bottom: 20} // only half bigger
|
||||||
|
c := Box{Top: 1, Left: 1, Right: 30, Bottom: 30} //bigger
|
||||||
|
assert.False(a.IsSmallerThan(b))
|
||||||
|
assert.True(a.IsSmallerThan(c))
|
||||||
|
assert.False(c.IsSmallerThan(a))
|
||||||
|
}
|
||||||
|
|
||||||
|
func TestBoxGrow(t *testing.T) {
|
||||||
|
assert := assert.New(t)
|
||||||
|
|
||||||
|
a := Box{Top: 1, Left: 2, Right: 15, Bottom: 15}
|
||||||
|
b := Box{Top: 4, Left: 5, Right: 30, Bottom: 35}
|
||||||
|
c := a.Grow(b)
|
||||||
|
assert.False(c.Equals(b))
|
||||||
|
assert.False(c.Equals(a))
|
||||||
|
assert.Equal(1, c.Top)
|
||||||
|
assert.Equal(2, c.Left)
|
||||||
|
assert.Equal(30, c.Right)
|
||||||
|
assert.Equal(35, c.Bottom)
|
||||||
|
}
|
||||||
|
|
||||||
|
func TestBoxFit(t *testing.T) {
|
||||||
|
assert := assert.New(t)
|
||||||
|
|
||||||
|
a := Box{Top: 64, Left: 64, Right: 192, Bottom: 192}
|
||||||
|
b := Box{Top: 16, Left: 16, Right: 256, Bottom: 170}
|
||||||
|
c := Box{Top: 16, Left: 16, Right: 170, Bottom: 256}
|
||||||
|
|
||||||
|
fab := a.Fit(b)
|
||||||
|
assert.Equal(a.Left, fab.Left)
|
||||||
|
assert.Equal(a.Right, fab.Right)
|
||||||
|
assert.True(fab.Top < fab.Bottom)
|
||||||
|
assert.True(fab.Left < fab.Right)
|
||||||
|
assert.True(math.Abs(b.Aspect()-fab.Aspect()) < 0.02)
|
||||||
|
|
||||||
|
fac := a.Fit(c)
|
||||||
|
assert.Equal(a.Top, fac.Top)
|
||||||
|
assert.Equal(a.Bottom, fac.Bottom)
|
||||||
|
assert.True(math.Abs(c.Aspect()-fac.Aspect()) < 0.02)
|
||||||
|
}
|
||||||
|
|
||||||
|
func TestBoxConstrain(t *testing.T) {
|
||||||
|
assert := assert.New(t)
|
||||||
|
|
||||||
|
a := Box{Top: 64, Left: 64, Right: 192, Bottom: 192}
|
||||||
|
b := Box{Top: 16, Left: 16, Right: 256, Bottom: 170}
|
||||||
|
c := Box{Top: 16, Left: 16, Right: 170, Bottom: 256}
|
||||||
|
|
||||||
|
cab := a.Constrain(b)
|
||||||
|
assert.Equal(64, cab.Top)
|
||||||
|
assert.Equal(64, cab.Left)
|
||||||
|
assert.Equal(192, cab.Right)
|
||||||
|
assert.Equal(170, cab.Bottom)
|
||||||
|
|
||||||
|
cac := a.Constrain(c)
|
||||||
|
assert.Equal(64, cac.Top)
|
||||||
|
assert.Equal(64, cac.Left)
|
||||||
|
assert.Equal(170, cac.Right)
|
||||||
|
assert.Equal(192, cac.Bottom)
|
||||||
|
}
|
||||||
|
|
||||||
|
func TestBoxOuterConstrain(t *testing.T) {
|
||||||
|
assert := assert.New(t)
|
||||||
|
|
||||||
|
box := NewBox(0, 0, 100, 100)
|
||||||
|
canvas := NewBox(5, 5, 95, 95)
|
||||||
|
taller := NewBox(-10, 5, 50, 50)
|
||||||
|
|
||||||
|
c := canvas.OuterConstrain(box, taller)
|
||||||
|
assert.Equal(15, c.Top, c.String())
|
||||||
|
assert.Equal(5, c.Left, c.String())
|
||||||
|
assert.Equal(95, c.Right, c.String())
|
||||||
|
assert.Equal(95, c.Bottom, c.String())
|
||||||
|
|
||||||
|
wider := NewBox(5, 5, 110, 50)
|
||||||
|
d := canvas.OuterConstrain(box, wider)
|
||||||
|
assert.Equal(5, d.Top, d.String())
|
||||||
|
assert.Equal(5, d.Left, d.String())
|
||||||
|
assert.Equal(85, d.Right, d.String())
|
||||||
|
assert.Equal(95, d.Bottom, d.String())
|
||||||
|
}
|
||||||
|
|
||||||
|
func TestBoxShift(t *testing.T) {
|
||||||
|
assert := assert.New(t)
|
||||||
|
|
||||||
|
b := Box{
|
||||||
|
Top: 5,
|
||||||
|
Left: 5,
|
||||||
|
Right: 10,
|
||||||
|
Bottom: 10,
|
||||||
|
}
|
||||||
|
|
||||||
|
shifted := b.Shift(1, 2)
|
||||||
|
assert.Equal(7, shifted.Top)
|
||||||
|
assert.Equal(6, shifted.Left)
|
||||||
|
assert.Equal(11, shifted.Right)
|
||||||
|
assert.Equal(12, shifted.Bottom)
|
||||||
|
}
|
||||||
|
|
||||||
|
func TestBoxCenter(t *testing.T) {
|
||||||
|
assert := assert.New(t)
|
||||||
|
|
||||||
|
b := Box{
|
||||||
|
Top: 10,
|
||||||
|
Left: 10,
|
||||||
|
Right: 20,
|
||||||
|
Bottom: 30,
|
||||||
|
}
|
||||||
|
cx, cy := b.Center()
|
||||||
|
assert.Equal(15, cx)
|
||||||
|
assert.Equal(20, cy)
|
||||||
|
}
|
||||||
|
|
||||||
|
func TestBoxCornersCenter(t *testing.T) {
|
||||||
|
assert := assert.New(t)
|
||||||
|
|
||||||
|
bc := BoxCorners{
|
||||||
|
TopLeft: Point{5, 5},
|
||||||
|
TopRight: Point{15, 5},
|
||||||
|
BottomRight: Point{15, 15},
|
||||||
|
BottomLeft: Point{5, 15},
|
||||||
|
}
|
||||||
|
|
||||||
|
cx, cy := bc.Center()
|
||||||
|
assert.Equal(10, cx)
|
||||||
|
assert.Equal(10, cy)
|
||||||
|
}
|
||||||
|
|
||||||
|
func TestBoxCornersRotate(t *testing.T) {
|
||||||
|
assert := assert.New(t)
|
||||||
|
|
||||||
|
bc := BoxCorners{
|
||||||
|
TopLeft: Point{5, 5},
|
||||||
|
TopRight: Point{15, 5},
|
||||||
|
BottomRight: Point{15, 15},
|
||||||
|
BottomLeft: Point{5, 15},
|
||||||
|
}
|
||||||
|
|
||||||
|
rotated := bc.Rotate(45)
|
||||||
|
assert.True(rotated.TopLeft.Equals(Point{10, 3}), rotated.String())
|
||||||
|
}
|
||||||
74
chart.go
|
|
@ -6,8 +6,7 @@ import (
|
||||||
"io"
|
"io"
|
||||||
"math"
|
"math"
|
||||||
|
|
||||||
util "git.fireandbrimst.one/aw/go-chart/util"
|
"github.com/golang/freetype/truetype"
|
||||||
"git.fireandbrimst.one/aw/golang-freetype/truetype"
|
|
||||||
)
|
)
|
||||||
|
|
||||||
// Chart is what we're drawing.
|
// Chart is what we're drawing.
|
||||||
|
|
@ -15,8 +14,6 @@ type Chart struct {
|
||||||
Title string
|
Title string
|
||||||
TitleStyle Style
|
TitleStyle Style
|
||||||
|
|
||||||
ColorPalette ColorPalette
|
|
||||||
|
|
||||||
Width int
|
Width int
|
||||||
Height int
|
Height int
|
||||||
DPI float64
|
DPI float64
|
||||||
|
|
@ -101,11 +98,11 @@ func (c Chart) Render(rp RendererProvider, w io.Writer) error {
|
||||||
xr, yr, yra := c.getRanges()
|
xr, yr, yra := c.getRanges()
|
||||||
canvasBox := c.getDefaultCanvasBox()
|
canvasBox := c.getDefaultCanvasBox()
|
||||||
xf, yf, yfa := c.getValueFormatters()
|
xf, yf, yfa := c.getValueFormatters()
|
||||||
|
|
||||||
xr, yr, yra = c.setRangeDomains(canvasBox, xr, yr, yra)
|
xr, yr, yra = c.setRangeDomains(canvasBox, xr, yr, yra)
|
||||||
|
|
||||||
err = c.checkRanges(xr, yr, yra)
|
err = c.checkRanges(xr, yr, yra)
|
||||||
if err != nil {
|
if err != nil {
|
||||||
|
// (try to) dump the raw background to the stream.
|
||||||
r.Save(w)
|
r.Save(w)
|
||||||
return err
|
return err
|
||||||
}
|
}
|
||||||
|
|
@ -178,10 +175,10 @@ func (c Chart) getRanges() (xrange, yrange, yrangeAlt Range) {
|
||||||
for _, s := range c.Series {
|
for _, s := range c.Series {
|
||||||
if s.GetStyle().IsZero() || s.GetStyle().Show {
|
if s.GetStyle().IsZero() || s.GetStyle().Show {
|
||||||
seriesAxis := s.GetYAxis()
|
seriesAxis := s.GetYAxis()
|
||||||
if bvp, isBoundedValuesProvider := s.(BoundedValuesProvider); isBoundedValuesProvider {
|
if bvp, isBoundedValueProvider := s.(BoundedValueProvider); isBoundedValueProvider {
|
||||||
seriesLength := bvp.Len()
|
seriesLength := bvp.Len()
|
||||||
for index := 0; index < seriesLength; index++ {
|
for index := 0; index < seriesLength; index++ {
|
||||||
vx, vy1, vy2 := bvp.GetBoundedValues(index)
|
vx, vy1, vy2 := bvp.GetBoundedValue(index)
|
||||||
|
|
||||||
minx = math.Min(minx, vx)
|
minx = math.Min(minx, vx)
|
||||||
maxx = math.Max(maxx, vx)
|
maxx = math.Max(maxx, vx)
|
||||||
|
|
@ -199,10 +196,10 @@ func (c Chart) getRanges() (xrange, yrange, yrangeAlt Range) {
|
||||||
seriesMappedToSecondaryAxis = true
|
seriesMappedToSecondaryAxis = true
|
||||||
}
|
}
|
||||||
}
|
}
|
||||||
} else if vp, isValuesProvider := s.(ValuesProvider); isValuesProvider {
|
} else if vp, isValueProvider := s.(ValueProvider); isValueProvider {
|
||||||
seriesLength := vp.Len()
|
seriesLength := vp.Len()
|
||||||
for index := 0; index < seriesLength; index++ {
|
for index := 0; index < seriesLength; index++ {
|
||||||
vx, vy := vp.GetValues(index)
|
vx, vy := vp.GetValue(index)
|
||||||
|
|
||||||
minx = math.Min(minx, vx)
|
minx = math.Min(minx, vx)
|
||||||
maxx = math.Max(maxx, vx)
|
maxx = math.Max(maxx, vx)
|
||||||
|
|
@ -263,15 +260,11 @@ func (c Chart) getRanges() (xrange, yrange, yrangeAlt Range) {
|
||||||
yrange.SetMin(miny)
|
yrange.SetMin(miny)
|
||||||
yrange.SetMax(maxy)
|
yrange.SetMax(maxy)
|
||||||
|
|
||||||
// only round if we're showing the axis
|
delta := yrange.GetDelta()
|
||||||
if c.YAxis.Style.Show {
|
roundTo := Math.GetRoundToForDelta(delta)
|
||||||
delta := yrange.GetDelta()
|
rmin, rmax := Math.RoundDown(yrange.GetMin(), roundTo), Math.RoundUp(yrange.GetMax(), roundTo)
|
||||||
roundTo := util.Math.GetRoundToForDelta(delta)
|
yrange.SetMin(rmin)
|
||||||
rmin, rmax := util.Math.RoundDown(yrange.GetMin(), roundTo), util.Math.RoundUp(yrange.GetMax(), roundTo)
|
yrange.SetMax(rmax)
|
||||||
|
|
||||||
yrange.SetMin(rmin)
|
|
||||||
yrange.SetMax(rmax)
|
|
||||||
}
|
|
||||||
}
|
}
|
||||||
|
|
||||||
if len(c.YAxisSecondary.Ticks) > 0 {
|
if len(c.YAxisSecondary.Ticks) > 0 {
|
||||||
|
|
@ -286,13 +279,11 @@ func (c Chart) getRanges() (xrange, yrange, yrangeAlt Range) {
|
||||||
yrangeAlt.SetMin(minya)
|
yrangeAlt.SetMin(minya)
|
||||||
yrangeAlt.SetMax(maxya)
|
yrangeAlt.SetMax(maxya)
|
||||||
|
|
||||||
if c.YAxisSecondary.Style.Show {
|
delta := yrangeAlt.GetDelta()
|
||||||
delta := yrangeAlt.GetDelta()
|
roundTo := Math.GetRoundToForDelta(delta)
|
||||||
roundTo := util.Math.GetRoundToForDelta(delta)
|
rmin, rmax := Math.RoundDown(yrangeAlt.GetMin(), roundTo), Math.RoundUp(yrangeAlt.GetMax(), roundTo)
|
||||||
rmin, rmax := util.Math.RoundDown(yrangeAlt.GetMin(), roundTo), util.Math.RoundUp(yrangeAlt.GetMax(), roundTo)
|
yrangeAlt.SetMin(rmin)
|
||||||
yrangeAlt.SetMin(rmin)
|
yrangeAlt.SetMax(rmax)
|
||||||
yrangeAlt.SetMax(rmax)
|
|
||||||
}
|
|
||||||
}
|
}
|
||||||
|
|
||||||
return
|
return
|
||||||
|
|
@ -349,13 +340,13 @@ func (c Chart) getValueFormatters() (x, y, ya ValueFormatter) {
|
||||||
}
|
}
|
||||||
}
|
}
|
||||||
if c.XAxis.ValueFormatter != nil {
|
if c.XAxis.ValueFormatter != nil {
|
||||||
x = c.XAxis.GetValueFormatter()
|
x = c.XAxis.ValueFormatter
|
||||||
}
|
}
|
||||||
if c.YAxis.ValueFormatter != nil {
|
if c.YAxis.ValueFormatter != nil {
|
||||||
y = c.YAxis.GetValueFormatter()
|
y = c.YAxis.ValueFormatter
|
||||||
}
|
}
|
||||||
if c.YAxisSecondary.ValueFormatter != nil {
|
if c.YAxisSecondary.ValueFormatter != nil {
|
||||||
ya = c.YAxisSecondary.GetValueFormatter()
|
ya = c.YAxisSecondary.ValueFormatter
|
||||||
}
|
}
|
||||||
return
|
return
|
||||||
}
|
}
|
||||||
|
|
@ -487,7 +478,7 @@ func (c Chart) drawSeries(r Renderer, canvasBox Box, xrange, yrange, yrangeAlt R
|
||||||
func (c Chart) drawTitle(r Renderer) {
|
func (c Chart) drawTitle(r Renderer) {
|
||||||
if len(c.Title) > 0 && c.TitleStyle.Show {
|
if len(c.Title) > 0 && c.TitleStyle.Show {
|
||||||
r.SetFont(c.TitleStyle.GetFont(c.GetFont()))
|
r.SetFont(c.TitleStyle.GetFont(c.GetFont()))
|
||||||
r.SetFontColor(c.TitleStyle.GetFontColor(c.GetColorPalette().TextColor()))
|
r.SetFontColor(c.TitleStyle.GetFontColor(DefaultTextColor))
|
||||||
titleFontSize := c.TitleStyle.GetFontSize(DefaultTitleFontSize)
|
titleFontSize := c.TitleStyle.GetFontSize(DefaultTitleFontSize)
|
||||||
r.SetFontSize(titleFontSize)
|
r.SetFontSize(titleFontSize)
|
||||||
|
|
||||||
|
|
@ -505,24 +496,25 @@ func (c Chart) drawTitle(r Renderer) {
|
||||||
|
|
||||||
func (c Chart) styleDefaultsBackground() Style {
|
func (c Chart) styleDefaultsBackground() Style {
|
||||||
return Style{
|
return Style{
|
||||||
FillColor: c.GetColorPalette().BackgroundColor(),
|
FillColor: DefaultBackgroundColor,
|
||||||
StrokeColor: c.GetColorPalette().BackgroundStrokeColor(),
|
StrokeColor: DefaultBackgroundStrokeColor,
|
||||||
StrokeWidth: DefaultBackgroundStrokeWidth,
|
StrokeWidth: DefaultBackgroundStrokeWidth,
|
||||||
}
|
}
|
||||||
}
|
}
|
||||||
|
|
||||||
func (c Chart) styleDefaultsCanvas() Style {
|
func (c Chart) styleDefaultsCanvas() Style {
|
||||||
return Style{
|
return Style{
|
||||||
FillColor: c.GetColorPalette().CanvasColor(),
|
FillColor: DefaultCanvasColor,
|
||||||
StrokeColor: c.GetColorPalette().CanvasStrokeColor(),
|
StrokeColor: DefaultCanvasStrokeColor,
|
||||||
StrokeWidth: DefaultCanvasStrokeWidth,
|
StrokeWidth: DefaultCanvasStrokeWidth,
|
||||||
}
|
}
|
||||||
}
|
}
|
||||||
|
|
||||||
func (c Chart) styleDefaultsSeries(seriesIndex int) Style {
|
func (c Chart) styleDefaultsSeries(seriesIndex int) Style {
|
||||||
|
strokeColor := GetDefaultColor(seriesIndex)
|
||||||
return Style{
|
return Style{
|
||||||
DotColor: c.GetColorPalette().GetSeriesColor(seriesIndex),
|
DotColor: strokeColor,
|
||||||
StrokeColor: c.GetColorPalette().GetSeriesColor(seriesIndex),
|
StrokeColor: strokeColor,
|
||||||
StrokeWidth: DefaultSeriesLineWidth,
|
StrokeWidth: DefaultSeriesLineWidth,
|
||||||
Font: c.GetFont(),
|
Font: c.GetFont(),
|
||||||
FontSize: DefaultFontSize,
|
FontSize: DefaultFontSize,
|
||||||
|
|
@ -532,9 +524,9 @@ func (c Chart) styleDefaultsSeries(seriesIndex int) Style {
|
||||||
func (c Chart) styleDefaultsAxes() Style {
|
func (c Chart) styleDefaultsAxes() Style {
|
||||||
return Style{
|
return Style{
|
||||||
Font: c.GetFont(),
|
Font: c.GetFont(),
|
||||||
FontColor: c.GetColorPalette().TextColor(),
|
FontColor: DefaultAxisColor,
|
||||||
FontSize: DefaultAxisFontSize,
|
FontSize: DefaultAxisFontSize,
|
||||||
StrokeColor: c.GetColorPalette().AxisStrokeColor(),
|
StrokeColor: DefaultAxisColor,
|
||||||
StrokeWidth: DefaultAxisLineWidth,
|
StrokeWidth: DefaultAxisLineWidth,
|
||||||
}
|
}
|
||||||
}
|
}
|
||||||
|
|
@ -545,14 +537,6 @@ func (c Chart) styleDefaultsElements() Style {
|
||||||
}
|
}
|
||||||
}
|
}
|
||||||
|
|
||||||
// GetColorPalette returns the color palette for the chart.
|
|
||||||
func (c Chart) GetColorPalette() ColorPalette {
|
|
||||||
if c.ColorPalette != nil {
|
|
||||||
return c.ColorPalette
|
|
||||||
}
|
|
||||||
return DefaultColorPalette
|
|
||||||
}
|
|
||||||
|
|
||||||
// Box returns the chart bounds as a box.
|
// Box returns the chart bounds as a box.
|
||||||
func (c Chart) Box() Box {
|
func (c Chart) Box() Box {
|
||||||
dpr := c.Background.Padding.GetRight(DefaultBackgroundPadding.Right)
|
dpr := c.Background.Padding.GetRight(DefaultBackgroundPadding.Right)
|
||||||
|
|
|
||||||
575
chart_test.go
Normal file
|
|
@ -0,0 +1,575 @@
|
||||||
|
package chart
|
||||||
|
|
||||||
|
import (
|
||||||
|
"bytes"
|
||||||
|
"image"
|
||||||
|
"image/png"
|
||||||
|
"math"
|
||||||
|
"testing"
|
||||||
|
"time"
|
||||||
|
|
||||||
|
"github.com/blendlabs/go-assert"
|
||||||
|
"github.com/wcharczuk/go-chart/drawing"
|
||||||
|
)
|
||||||
|
|
||||||
|
func TestChartGetDPI(t *testing.T) {
|
||||||
|
assert := assert.New(t)
|
||||||
|
|
||||||
|
unset := Chart{}
|
||||||
|
assert.Equal(DefaultDPI, unset.GetDPI())
|
||||||
|
assert.Equal(192, unset.GetDPI(192))
|
||||||
|
|
||||||
|
set := Chart{DPI: 128}
|
||||||
|
assert.Equal(128, set.GetDPI())
|
||||||
|
assert.Equal(128, set.GetDPI(192))
|
||||||
|
}
|
||||||
|
|
||||||
|
func TestChartGetFont(t *testing.T) {
|
||||||
|
assert := assert.New(t)
|
||||||
|
|
||||||
|
f, err := GetDefaultFont()
|
||||||
|
assert.Nil(err)
|
||||||
|
|
||||||
|
unset := Chart{}
|
||||||
|
assert.Nil(unset.GetFont())
|
||||||
|
|
||||||
|
set := Chart{Font: f}
|
||||||
|
assert.NotNil(set.GetFont())
|
||||||
|
}
|
||||||
|
|
||||||
|
func TestChartGetWidth(t *testing.T) {
|
||||||
|
assert := assert.New(t)
|
||||||
|
|
||||||
|
unset := Chart{}
|
||||||
|
assert.Equal(DefaultChartWidth, unset.GetWidth())
|
||||||
|
|
||||||
|
set := Chart{Width: DefaultChartWidth + 10}
|
||||||
|
assert.Equal(DefaultChartWidth+10, set.GetWidth())
|
||||||
|
}
|
||||||
|
|
||||||
|
func TestChartGetHeight(t *testing.T) {
|
||||||
|
assert := assert.New(t)
|
||||||
|
|
||||||
|
unset := Chart{}
|
||||||
|
assert.Equal(DefaultChartHeight, unset.GetHeight())
|
||||||
|
|
||||||
|
set := Chart{Height: DefaultChartHeight + 10}
|
||||||
|
assert.Equal(DefaultChartHeight+10, set.GetHeight())
|
||||||
|
}
|
||||||
|
|
||||||
|
func TestChartGetRanges(t *testing.T) {
|
||||||
|
assert := assert.New(t)
|
||||||
|
|
||||||
|
c := Chart{
|
||||||
|
Series: []Series{
|
||||||
|
ContinuousSeries{
|
||||||
|
XValues: []float64{-2.0, -1.0, 0, 1.0, 2.0},
|
||||||
|
YValues: []float64{1.0, 2.0, 3.0, 4.0, 4.5},
|
||||||
|
},
|
||||||
|
ContinuousSeries{
|
||||||
|
XValues: []float64{1.0, 2.0, 3.0, 4.0, 5.0},
|
||||||
|
YValues: []float64{-2.1, -1.0, 0, 1.0, 2.0},
|
||||||
|
},
|
||||||
|
ContinuousSeries{
|
||||||
|
YAxis: YAxisSecondary,
|
||||||
|
XValues: []float64{1.0, 2.0, 3.0, 4.0, 5.0},
|
||||||
|
YValues: []float64{10.0, 11.0, 12.0, 13.0, 14.0},
|
||||||
|
},
|
||||||
|
},
|
||||||
|
}
|
||||||
|
|
||||||
|
xrange, yrange, yrangeAlt := c.getRanges()
|
||||||
|
assert.Equal(-2.0, xrange.GetMin())
|
||||||
|
assert.Equal(5.0, xrange.GetMax())
|
||||||
|
|
||||||
|
assert.Equal(-2.1, yrange.GetMin())
|
||||||
|
assert.Equal(4.5, yrange.GetMax())
|
||||||
|
|
||||||
|
assert.Equal(10.0, yrangeAlt.GetMin())
|
||||||
|
assert.Equal(14.0, yrangeAlt.GetMax())
|
||||||
|
|
||||||
|
cSet := Chart{
|
||||||
|
XAxis: XAxis{
|
||||||
|
Range: &ContinuousRange{Min: 9.8, Max: 19.8},
|
||||||
|
},
|
||||||
|
YAxis: YAxis{
|
||||||
|
Range: &ContinuousRange{Min: 9.9, Max: 19.9},
|
||||||
|
},
|
||||||
|
YAxisSecondary: YAxis{
|
||||||
|
Range: &ContinuousRange{Min: 9.7, Max: 19.7},
|
||||||
|
},
|
||||||
|
Series: []Series{
|
||||||
|
ContinuousSeries{
|
||||||
|
XValues: []float64{-2.0, -1.0, 0, 1.0, 2.0},
|
||||||
|
YValues: []float64{1.0, 2.0, 3.0, 4.0, 4.5},
|
||||||
|
},
|
||||||
|
ContinuousSeries{
|
||||||
|
XValues: []float64{1.0, 2.0, 3.0, 4.0, 5.0},
|
||||||
|
YValues: []float64{-2.1, -1.0, 0, 1.0, 2.0},
|
||||||
|
},
|
||||||
|
ContinuousSeries{
|
||||||
|
YAxis: YAxisSecondary,
|
||||||
|
XValues: []float64{1.0, 2.0, 3.0, 4.0, 5.0},
|
||||||
|
YValues: []float64{10.0, 11.0, 12.0, 13.0, 14.0},
|
||||||
|
},
|
||||||
|
},
|
||||||
|
}
|
||||||
|
|
||||||
|
xr2, yr2, yra2 := cSet.getRanges()
|
||||||
|
assert.Equal(9.8, xr2.GetMin())
|
||||||
|
assert.Equal(19.8, xr2.GetMax())
|
||||||
|
|
||||||
|
assert.Equal(9.9, yr2.GetMin())
|
||||||
|
assert.Equal(19.9, yr2.GetMax())
|
||||||
|
|
||||||
|
assert.Equal(9.7, yra2.GetMin())
|
||||||
|
assert.Equal(19.7, yra2.GetMax())
|
||||||
|
}
|
||||||
|
|
||||||
|
func TestChartGetRangesUseTicks(t *testing.T) {
|
||||||
|
assert := assert.New(t)
|
||||||
|
|
||||||
|
// this test asserts that ticks should supercede manual ranges when generating the overall ranges.
|
||||||
|
|
||||||
|
c := Chart{
|
||||||
|
YAxis: YAxis{
|
||||||
|
Ticks: []Tick{
|
||||||
|
{0.0, "Zero"},
|
||||||
|
{1.0, "1.0"},
|
||||||
|
{2.0, "2.0"},
|
||||||
|
{3.0, "3.0"},
|
||||||
|
{4.0, "4.0"},
|
||||||
|
{5.0, "Five"},
|
||||||
|
},
|
||||||
|
Range: &ContinuousRange{
|
||||||
|
Min: -5.0,
|
||||||
|
Max: 5.0,
|
||||||
|
},
|
||||||
|
},
|
||||||
|
Series: []Series{
|
||||||
|
ContinuousSeries{
|
||||||
|
XValues: []float64{-2.0, -1.0, 0, 1.0, 2.0},
|
||||||
|
YValues: []float64{1.0, 2.0, 3.0, 4.0, 4.5},
|
||||||
|
},
|
||||||
|
},
|
||||||
|
}
|
||||||
|
|
||||||
|
xr, yr, yar := c.getRanges()
|
||||||
|
assert.Equal(-2.0, xr.GetMin())
|
||||||
|
assert.Equal(2.0, xr.GetMax())
|
||||||
|
assert.Equal(0.0, yr.GetMin())
|
||||||
|
assert.Equal(5.0, yr.GetMax())
|
||||||
|
assert.True(yar.IsZero(), yar.String())
|
||||||
|
}
|
||||||
|
|
||||||
|
func TestChartGetRangesUseUserRanges(t *testing.T) {
|
||||||
|
assert := assert.New(t)
|
||||||
|
|
||||||
|
c := Chart{
|
||||||
|
YAxis: YAxis{
|
||||||
|
Range: &ContinuousRange{
|
||||||
|
Min: -5.0,
|
||||||
|
Max: 5.0,
|
||||||
|
},
|
||||||
|
},
|
||||||
|
Series: []Series{
|
||||||
|
ContinuousSeries{
|
||||||
|
XValues: []float64{-2.0, -1.0, 0, 1.0, 2.0},
|
||||||
|
YValues: []float64{1.0, 2.0, 3.0, 4.0, 4.5},
|
||||||
|
},
|
||||||
|
},
|
||||||
|
}
|
||||||
|
|
||||||
|
xr, yr, yar := c.getRanges()
|
||||||
|
assert.Equal(-2.0, xr.GetMin())
|
||||||
|
assert.Equal(2.0, xr.GetMax())
|
||||||
|
assert.Equal(-5.0, yr.GetMin())
|
||||||
|
assert.Equal(5.0, yr.GetMax())
|
||||||
|
assert.True(yar.IsZero(), yar.String())
|
||||||
|
}
|
||||||
|
|
||||||
|
func TestChartGetBackgroundStyle(t *testing.T) {
|
||||||
|
assert := assert.New(t)
|
||||||
|
|
||||||
|
c := Chart{
|
||||||
|
Background: Style{
|
||||||
|
FillColor: drawing.ColorBlack,
|
||||||
|
},
|
||||||
|
}
|
||||||
|
|
||||||
|
bs := c.getBackgroundStyle()
|
||||||
|
assert.Equal(bs.FillColor.String(), drawing.ColorBlack.String())
|
||||||
|
}
|
||||||
|
|
||||||
|
func TestChartGetCanvasStyle(t *testing.T) {
|
||||||
|
assert := assert.New(t)
|
||||||
|
|
||||||
|
c := Chart{
|
||||||
|
Canvas: Style{
|
||||||
|
FillColor: drawing.ColorBlack,
|
||||||
|
},
|
||||||
|
}
|
||||||
|
|
||||||
|
bs := c.getCanvasStyle()
|
||||||
|
assert.Equal(bs.FillColor.String(), drawing.ColorBlack.String())
|
||||||
|
}
|
||||||
|
|
||||||
|
func TestChartGetDefaultCanvasBox(t *testing.T) {
|
||||||
|
assert := assert.New(t)
|
||||||
|
|
||||||
|
c := Chart{}
|
||||||
|
canvasBoxDefault := c.getDefaultCanvasBox()
|
||||||
|
assert.False(canvasBoxDefault.IsZero())
|
||||||
|
assert.Equal(DefaultBackgroundPadding.Top, canvasBoxDefault.Top)
|
||||||
|
assert.Equal(DefaultBackgroundPadding.Left, canvasBoxDefault.Left)
|
||||||
|
assert.Equal(c.GetWidth()-DefaultBackgroundPadding.Right, canvasBoxDefault.Right)
|
||||||
|
assert.Equal(c.GetHeight()-DefaultBackgroundPadding.Bottom, canvasBoxDefault.Bottom)
|
||||||
|
|
||||||
|
custom := Chart{
|
||||||
|
Background: Style{
|
||||||
|
Padding: Box{
|
||||||
|
Top: DefaultBackgroundPadding.Top + 1,
|
||||||
|
Left: DefaultBackgroundPadding.Left + 1,
|
||||||
|
Right: DefaultBackgroundPadding.Right + 1,
|
||||||
|
Bottom: DefaultBackgroundPadding.Bottom + 1,
|
||||||
|
},
|
||||||
|
},
|
||||||
|
}
|
||||||
|
canvasBoxCustom := custom.getDefaultCanvasBox()
|
||||||
|
assert.False(canvasBoxCustom.IsZero())
|
||||||
|
assert.Equal(DefaultBackgroundPadding.Top+1, canvasBoxCustom.Top)
|
||||||
|
assert.Equal(DefaultBackgroundPadding.Left+1, canvasBoxCustom.Left)
|
||||||
|
assert.Equal(c.GetWidth()-(DefaultBackgroundPadding.Right+1), canvasBoxCustom.Right)
|
||||||
|
assert.Equal(c.GetHeight()-(DefaultBackgroundPadding.Bottom+1), canvasBoxCustom.Bottom)
|
||||||
|
}
|
||||||
|
|
||||||
|
func TestChartGetValueFormatters(t *testing.T) {
|
||||||
|
assert := assert.New(t)
|
||||||
|
|
||||||
|
c := Chart{
|
||||||
|
Series: []Series{
|
||||||
|
ContinuousSeries{
|
||||||
|
XValues: []float64{-2.0, -1.0, 0, 1.0, 2.0},
|
||||||
|
YValues: []float64{1.0, 2.0, 3.0, 4.0, 4.5},
|
||||||
|
},
|
||||||
|
ContinuousSeries{
|
||||||
|
XValues: []float64{1.0, 2.0, 3.0, 4.0, 5.0},
|
||||||
|
YValues: []float64{-2.1, -1.0, 0, 1.0, 2.0},
|
||||||
|
},
|
||||||
|
ContinuousSeries{
|
||||||
|
YAxis: YAxisSecondary,
|
||||||
|
XValues: []float64{1.0, 2.0, 3.0, 4.0, 5.0},
|
||||||
|
YValues: []float64{10.0, 11.0, 12.0, 13.0, 14.0},
|
||||||
|
},
|
||||||
|
},
|
||||||
|
}
|
||||||
|
|
||||||
|
dxf, dyf, dyaf := c.getValueFormatters()
|
||||||
|
assert.NotNil(dxf)
|
||||||
|
assert.NotNil(dyf)
|
||||||
|
assert.NotNil(dyaf)
|
||||||
|
}
|
||||||
|
|
||||||
|
func TestChartHasAxes(t *testing.T) {
|
||||||
|
assert := assert.New(t)
|
||||||
|
|
||||||
|
assert.False(Chart{}.hasAxes())
|
||||||
|
|
||||||
|
x := Chart{
|
||||||
|
XAxis: XAxis{
|
||||||
|
Style: Style{
|
||||||
|
Show: true,
|
||||||
|
},
|
||||||
|
},
|
||||||
|
}
|
||||||
|
assert.True(x.hasAxes())
|
||||||
|
|
||||||
|
y := Chart{
|
||||||
|
YAxis: YAxis{
|
||||||
|
Style: Style{
|
||||||
|
Show: true,
|
||||||
|
},
|
||||||
|
},
|
||||||
|
}
|
||||||
|
assert.True(y.hasAxes())
|
||||||
|
|
||||||
|
ya := Chart{
|
||||||
|
YAxisSecondary: YAxis{
|
||||||
|
Style: Style{
|
||||||
|
Show: true,
|
||||||
|
},
|
||||||
|
},
|
||||||
|
}
|
||||||
|
assert.True(ya.hasAxes())
|
||||||
|
}
|
||||||
|
|
||||||
|
func TestChartGetAxesTicks(t *testing.T) {
|
||||||
|
assert := assert.New(t)
|
||||||
|
|
||||||
|
r, err := PNG(1024, 1024)
|
||||||
|
assert.Nil(err)
|
||||||
|
|
||||||
|
c := Chart{
|
||||||
|
XAxis: XAxis{
|
||||||
|
Style: Style{Show: true},
|
||||||
|
Range: &ContinuousRange{Min: 9.8, Max: 19.8},
|
||||||
|
},
|
||||||
|
YAxis: YAxis{
|
||||||
|
Style: Style{Show: true},
|
||||||
|
Range: &ContinuousRange{Min: 9.9, Max: 19.9},
|
||||||
|
},
|
||||||
|
YAxisSecondary: YAxis{
|
||||||
|
Style: Style{Show: true},
|
||||||
|
Range: &ContinuousRange{Min: 9.7, Max: 19.7},
|
||||||
|
},
|
||||||
|
}
|
||||||
|
xr, yr, yar := c.getRanges()
|
||||||
|
|
||||||
|
xt, yt, yat := c.getAxesTicks(r, xr, yr, yar, FloatValueFormatter, FloatValueFormatter, FloatValueFormatter)
|
||||||
|
assert.NotEmpty(xt)
|
||||||
|
assert.NotEmpty(yt)
|
||||||
|
assert.NotEmpty(yat)
|
||||||
|
}
|
||||||
|
|
||||||
|
func TestChartSingleSeries(t *testing.T) {
|
||||||
|
assert := assert.New(t)
|
||||||
|
now := time.Now()
|
||||||
|
c := Chart{
|
||||||
|
Title: "Hello!",
|
||||||
|
TitleStyle: StyleShow(),
|
||||||
|
Width: 1024,
|
||||||
|
Height: 400,
|
||||||
|
YAxis: YAxis{
|
||||||
|
Style: StyleShow(),
|
||||||
|
Range: &ContinuousRange{
|
||||||
|
Min: 0.0,
|
||||||
|
Max: 4.0,
|
||||||
|
},
|
||||||
|
},
|
||||||
|
XAxis: XAxis{
|
||||||
|
Style: StyleShow(),
|
||||||
|
},
|
||||||
|
Series: []Series{
|
||||||
|
TimeSeries{
|
||||||
|
Name: "goog",
|
||||||
|
XValues: []time.Time{now.AddDate(0, 0, -3), now.AddDate(0, 0, -2), now.AddDate(0, 0, -1)},
|
||||||
|
YValues: []float64{1.0, 2.0, 3.0},
|
||||||
|
},
|
||||||
|
},
|
||||||
|
}
|
||||||
|
|
||||||
|
buffer := bytes.NewBuffer([]byte{})
|
||||||
|
c.Render(PNG, buffer)
|
||||||
|
assert.NotEmpty(buffer.Bytes())
|
||||||
|
}
|
||||||
|
|
||||||
|
func TestChartRegressionBadRanges(t *testing.T) {
|
||||||
|
assert := assert.New(t)
|
||||||
|
|
||||||
|
c := Chart{
|
||||||
|
Series: []Series{
|
||||||
|
ContinuousSeries{
|
||||||
|
XValues: []float64{math.Inf(1), math.Inf(1), math.Inf(1), math.Inf(1), math.Inf(1)},
|
||||||
|
YValues: []float64{1.0, 2.0, 3.0, 4.0, 4.5},
|
||||||
|
},
|
||||||
|
},
|
||||||
|
}
|
||||||
|
buffer := bytes.NewBuffer([]byte{})
|
||||||
|
c.Render(PNG, buffer)
|
||||||
|
assert.True(true, "Render needs to finish.")
|
||||||
|
}
|
||||||
|
|
||||||
|
func TestChartRegressionBadRangesByUser(t *testing.T) {
|
||||||
|
assert := assert.New(t)
|
||||||
|
|
||||||
|
c := Chart{
|
||||||
|
YAxis: YAxis{
|
||||||
|
Range: &ContinuousRange{
|
||||||
|
Min: math.Inf(-1),
|
||||||
|
Max: math.Inf(1), // this could really happen? eh.
|
||||||
|
},
|
||||||
|
},
|
||||||
|
Series: []Series{
|
||||||
|
ContinuousSeries{
|
||||||
|
XValues: Sequence.Float64(1.0, 10.0),
|
||||||
|
YValues: Sequence.Float64(1.0, 10.0),
|
||||||
|
},
|
||||||
|
},
|
||||||
|
}
|
||||||
|
buffer := bytes.NewBuffer([]byte{})
|
||||||
|
c.Render(PNG, buffer)
|
||||||
|
assert.True(true, "Render needs to finish.")
|
||||||
|
}
|
||||||
|
|
||||||
|
func TestChartValidatesSeries(t *testing.T) {
|
||||||
|
assert := assert.New(t)
|
||||||
|
|
||||||
|
c := Chart{
|
||||||
|
Series: []Series{
|
||||||
|
ContinuousSeries{
|
||||||
|
XValues: Sequence.Float64(1.0, 10.0),
|
||||||
|
YValues: Sequence.Float64(1.0, 10.0),
|
||||||
|
},
|
||||||
|
},
|
||||||
|
}
|
||||||
|
|
||||||
|
assert.Nil(c.validateSeries())
|
||||||
|
|
||||||
|
c = Chart{
|
||||||
|
Series: []Series{
|
||||||
|
ContinuousSeries{
|
||||||
|
XValues: Sequence.Float64(1.0, 10.0),
|
||||||
|
},
|
||||||
|
},
|
||||||
|
}
|
||||||
|
|
||||||
|
assert.NotNil(c.validateSeries())
|
||||||
|
}
|
||||||
|
|
||||||
|
func TestChartCheckRanges(t *testing.T) {
|
||||||
|
assert := assert.New(t)
|
||||||
|
|
||||||
|
c := Chart{
|
||||||
|
Series: []Series{
|
||||||
|
ContinuousSeries{
|
||||||
|
XValues: []float64{1.0, 2.0},
|
||||||
|
YValues: []float64{3.10, 3.14},
|
||||||
|
},
|
||||||
|
},
|
||||||
|
}
|
||||||
|
|
||||||
|
xr, yr, yra := c.getRanges()
|
||||||
|
assert.Nil(c.checkRanges(xr, yr, yra))
|
||||||
|
}
|
||||||
|
|
||||||
|
func TestChartCheckRangesFailure(t *testing.T) {
|
||||||
|
assert := assert.New(t)
|
||||||
|
|
||||||
|
c := Chart{
|
||||||
|
Series: []Series{
|
||||||
|
ContinuousSeries{
|
||||||
|
XValues: []float64{1.0, 2.0},
|
||||||
|
YValues: []float64{3.14, 3.14},
|
||||||
|
},
|
||||||
|
},
|
||||||
|
}
|
||||||
|
|
||||||
|
xr, yr, yra := c.getRanges()
|
||||||
|
assert.NotNil(c.checkRanges(xr, yr, yra))
|
||||||
|
}
|
||||||
|
|
||||||
|
func TestChartCheckRangesWithRanges(t *testing.T) {
|
||||||
|
assert := assert.New(t)
|
||||||
|
|
||||||
|
c := Chart{
|
||||||
|
XAxis: XAxis{
|
||||||
|
Range: &ContinuousRange{
|
||||||
|
Min: 0,
|
||||||
|
Max: 10,
|
||||||
|
},
|
||||||
|
},
|
||||||
|
YAxis: YAxis{
|
||||||
|
Range: &ContinuousRange{
|
||||||
|
Min: 0,
|
||||||
|
Max: 5,
|
||||||
|
},
|
||||||
|
},
|
||||||
|
Series: []Series{
|
||||||
|
ContinuousSeries{
|
||||||
|
XValues: []float64{1.0, 2.0},
|
||||||
|
YValues: []float64{3.14, 3.14},
|
||||||
|
},
|
||||||
|
},
|
||||||
|
}
|
||||||
|
|
||||||
|
xr, yr, yra := c.getRanges()
|
||||||
|
assert.Nil(c.checkRanges(xr, yr, yra))
|
||||||
|
}
|
||||||
|
|
||||||
|
func at(i image.Image, x, y int) drawing.Color {
|
||||||
|
return drawing.ColorFromAlphaMixedRGBA(i.At(x, y).RGBA())
|
||||||
|
}
|
||||||
|
|
||||||
|
func TestChartE2ELine(t *testing.T) {
|
||||||
|
assert := assert.New(t)
|
||||||
|
|
||||||
|
c := Chart{
|
||||||
|
Height: 50,
|
||||||
|
Width: 50,
|
||||||
|
Canvas: Style{
|
||||||
|
Padding: Box{IsSet: true},
|
||||||
|
},
|
||||||
|
Background: Style{
|
||||||
|
Padding: Box{IsSet: true},
|
||||||
|
},
|
||||||
|
Series: []Series{
|
||||||
|
ContinuousSeries{
|
||||||
|
XValues: Sequence.Float64(0, 4, 1),
|
||||||
|
YValues: Sequence.Float64(0, 4, 1),
|
||||||
|
},
|
||||||
|
},
|
||||||
|
}
|
||||||
|
|
||||||
|
var buffer = &bytes.Buffer{}
|
||||||
|
err := c.Render(PNG, buffer)
|
||||||
|
assert.Nil(err)
|
||||||
|
|
||||||
|
// do color tests ...
|
||||||
|
|
||||||
|
i, err := png.Decode(buffer)
|
||||||
|
assert.Nil(err)
|
||||||
|
|
||||||
|
// test the bottom and top of the line
|
||||||
|
assert.Equal(drawing.ColorWhite, at(i, 0, 0))
|
||||||
|
assert.Equal(drawing.ColorWhite, at(i, 49, 49))
|
||||||
|
|
||||||
|
// test a line mid point
|
||||||
|
defaultSeriesColor := GetDefaultColor(0)
|
||||||
|
assert.Equal(defaultSeriesColor, at(i, 0, 49))
|
||||||
|
assert.Equal(defaultSeriesColor, at(i, 49, 0))
|
||||||
|
assert.Equal(drawing.ColorFromHex("bddbf6"), at(i, 24, 24))
|
||||||
|
}
|
||||||
|
|
||||||
|
func TestChartE2ELineWithFill(t *testing.T) {
|
||||||
|
assert := assert.New(t)
|
||||||
|
|
||||||
|
c := Chart{
|
||||||
|
Height: 50,
|
||||||
|
Width: 50,
|
||||||
|
Canvas: Style{
|
||||||
|
Padding: Box{IsSet: true},
|
||||||
|
},
|
||||||
|
Background: Style{
|
||||||
|
Padding: Box{IsSet: true},
|
||||||
|
},
|
||||||
|
Series: []Series{
|
||||||
|
ContinuousSeries{
|
||||||
|
Style: Style{
|
||||||
|
Show: true,
|
||||||
|
StrokeColor: drawing.ColorBlue,
|
||||||
|
FillColor: drawing.ColorRed,
|
||||||
|
},
|
||||||
|
XValues: Sequence.Float64(0, 4, 1),
|
||||||
|
YValues: Sequence.Float64(0, 4, 1),
|
||||||
|
},
|
||||||
|
},
|
||||||
|
}
|
||||||
|
|
||||||
|
var buffer = &bytes.Buffer{}
|
||||||
|
err := c.Render(PNG, buffer)
|
||||||
|
assert.Nil(err)
|
||||||
|
|
||||||
|
// do color tests ...
|
||||||
|
|
||||||
|
i, err := png.Decode(buffer)
|
||||||
|
assert.Nil(err)
|
||||||
|
|
||||||
|
// test the bottom and top of the line
|
||||||
|
assert.Equal(drawing.ColorWhite, at(i, 0, 0))
|
||||||
|
assert.Equal(drawing.ColorRed, at(i, 49, 49))
|
||||||
|
|
||||||
|
// test a line mid point
|
||||||
|
defaultSeriesColor := drawing.ColorBlue
|
||||||
|
assert.Equal(defaultSeriesColor, at(i, 0, 49))
|
||||||
|
assert.Equal(defaultSeriesColor, at(i, 49, 0))
|
||||||
|
}
|
||||||
184
colors.go
|
|
@ -1,184 +0,0 @@
|
||||||
package chart
|
|
||||||
|
|
||||||
import "git.fireandbrimst.one/aw/go-chart/drawing"
|
|
||||||
|
|
||||||
var (
|
|
||||||
// ColorWhite is white.
|
|
||||||
ColorWhite = drawing.Color{R: 255, G: 255, B: 255, A: 255}
|
|
||||||
// ColorBlue is the basic theme blue color.
|
|
||||||
ColorBlue = drawing.Color{R: 0, G: 116, B: 217, A: 255}
|
|
||||||
// ColorCyan is the basic theme cyan color.
|
|
||||||
ColorCyan = drawing.Color{R: 0, G: 217, B: 210, A: 255}
|
|
||||||
// ColorGreen is the basic theme green color.
|
|
||||||
ColorGreen = drawing.Color{R: 0, G: 217, B: 101, A: 255}
|
|
||||||
// ColorRed is the basic theme red color.
|
|
||||||
ColorRed = drawing.Color{R: 217, G: 0, B: 116, A: 255}
|
|
||||||
// ColorOrange is the basic theme orange color.
|
|
||||||
ColorOrange = drawing.Color{R: 217, G: 101, B: 0, A: 255}
|
|
||||||
// ColorYellow is the basic theme yellow color.
|
|
||||||
ColorYellow = drawing.Color{R: 217, G: 210, B: 0, A: 255}
|
|
||||||
// ColorBlack is the basic theme black color.
|
|
||||||
ColorBlack = drawing.Color{R: 51, G: 51, B: 51, A: 255}
|
|
||||||
// ColorLightGray is the basic theme light gray color.
|
|
||||||
ColorLightGray = drawing.Color{R: 239, G: 239, B: 239, A: 255}
|
|
||||||
|
|
||||||
// ColorAlternateBlue is a alternate theme color.
|
|
||||||
ColorAlternateBlue = drawing.Color{R: 106, G: 195, B: 203, A: 255}
|
|
||||||
// ColorAlternateGreen is a alternate theme color.
|
|
||||||
ColorAlternateGreen = drawing.Color{R: 42, G: 190, B: 137, A: 255}
|
|
||||||
// ColorAlternateGray is a alternate theme color.
|
|
||||||
ColorAlternateGray = drawing.Color{R: 110, G: 128, B: 139, A: 255}
|
|
||||||
// ColorAlternateYellow is a alternate theme color.
|
|
||||||
ColorAlternateYellow = drawing.Color{R: 240, G: 174, B: 90, A: 255}
|
|
||||||
// ColorAlternateLightGray is a alternate theme color.
|
|
||||||
ColorAlternateLightGray = drawing.Color{R: 187, G: 190, B: 191, A: 255}
|
|
||||||
|
|
||||||
// ColorTransparent is a transparent (alpha zero) color.
|
|
||||||
ColorTransparent = drawing.Color{R: 1, G: 1, B: 1, A: 0}
|
|
||||||
)
|
|
||||||
|
|
||||||
var (
|
|
||||||
// DefaultBackgroundColor is the default chart background color.
|
|
||||||
// It is equivalent to css color:white.
|
|
||||||
DefaultBackgroundColor = ColorWhite
|
|
||||||
// DefaultBackgroundStrokeColor is the default chart border color.
|
|
||||||
// It is equivalent to color:white.
|
|
||||||
DefaultBackgroundStrokeColor = ColorWhite
|
|
||||||
// DefaultCanvasColor is the default chart canvas color.
|
|
||||||
// It is equivalent to css color:white.
|
|
||||||
DefaultCanvasColor = ColorWhite
|
|
||||||
// DefaultCanvasStrokeColor is the default chart canvas stroke color.
|
|
||||||
// It is equivalent to css color:white.
|
|
||||||
DefaultCanvasStrokeColor = ColorWhite
|
|
||||||
// DefaultTextColor is the default chart text color.
|
|
||||||
// It is equivalent to #333333.
|
|
||||||
DefaultTextColor = ColorBlack
|
|
||||||
// DefaultAxisColor is the default chart axis line color.
|
|
||||||
// It is equivalent to #333333.
|
|
||||||
DefaultAxisColor = ColorBlack
|
|
||||||
// DefaultStrokeColor is the default chart border color.
|
|
||||||
// It is equivalent to #efefef.
|
|
||||||
DefaultStrokeColor = ColorLightGray
|
|
||||||
// DefaultFillColor is the default fill color.
|
|
||||||
// It is equivalent to #0074d9.
|
|
||||||
DefaultFillColor = ColorBlue
|
|
||||||
// DefaultAnnotationFillColor is the default annotation background color.
|
|
||||||
DefaultAnnotationFillColor = ColorWhite
|
|
||||||
// DefaultGridLineColor is the default grid line color.
|
|
||||||
DefaultGridLineColor = ColorLightGray
|
|
||||||
)
|
|
||||||
|
|
||||||
var (
|
|
||||||
// DefaultColors are a couple default series colors.
|
|
||||||
DefaultColors = []drawing.Color{
|
|
||||||
ColorBlue,
|
|
||||||
ColorGreen,
|
|
||||||
ColorRed,
|
|
||||||
ColorCyan,
|
|
||||||
ColorOrange,
|
|
||||||
}
|
|
||||||
|
|
||||||
// DefaultAlternateColors are a couple alternate colors.
|
|
||||||
DefaultAlternateColors = []drawing.Color{
|
|
||||||
ColorAlternateBlue,
|
|
||||||
ColorAlternateGreen,
|
|
||||||
ColorAlternateGray,
|
|
||||||
ColorAlternateYellow,
|
|
||||||
ColorBlue,
|
|
||||||
ColorGreen,
|
|
||||||
ColorRed,
|
|
||||||
ColorCyan,
|
|
||||||
ColorOrange,
|
|
||||||
}
|
|
||||||
)
|
|
||||||
|
|
||||||
// GetDefaultColor returns a color from the default list by index.
|
|
||||||
// NOTE: the index will wrap around (using a modulo).
|
|
||||||
func GetDefaultColor(index int) drawing.Color {
|
|
||||||
finalIndex := index % len(DefaultColors)
|
|
||||||
return DefaultColors[finalIndex]
|
|
||||||
}
|
|
||||||
|
|
||||||
// GetAlternateColor returns a color from the default list by index.
|
|
||||||
// NOTE: the index will wrap around (using a modulo).
|
|
||||||
func GetAlternateColor(index int) drawing.Color {
|
|
||||||
finalIndex := index % len(DefaultAlternateColors)
|
|
||||||
return DefaultAlternateColors[finalIndex]
|
|
||||||
}
|
|
||||||
|
|
||||||
// ColorPalette is a set of colors that.
|
|
||||||
type ColorPalette interface {
|
|
||||||
BackgroundColor() drawing.Color
|
|
||||||
BackgroundStrokeColor() drawing.Color
|
|
||||||
CanvasColor() drawing.Color
|
|
||||||
CanvasStrokeColor() drawing.Color
|
|
||||||
AxisStrokeColor() drawing.Color
|
|
||||||
TextColor() drawing.Color
|
|
||||||
GetSeriesColor(index int) drawing.Color
|
|
||||||
}
|
|
||||||
|
|
||||||
// DefaultColorPalette represents the default palatte.
|
|
||||||
var DefaultColorPalette defaultColorPalette
|
|
||||||
|
|
||||||
type defaultColorPalette struct{}
|
|
||||||
|
|
||||||
func (dp defaultColorPalette) BackgroundColor() drawing.Color {
|
|
||||||
return DefaultBackgroundColor
|
|
||||||
}
|
|
||||||
|
|
||||||
func (dp defaultColorPalette) BackgroundStrokeColor() drawing.Color {
|
|
||||||
return DefaultBackgroundStrokeColor
|
|
||||||
}
|
|
||||||
|
|
||||||
func (dp defaultColorPalette) CanvasColor() drawing.Color {
|
|
||||||
return DefaultCanvasColor
|
|
||||||
}
|
|
||||||
|
|
||||||
func (dp defaultColorPalette) CanvasStrokeColor() drawing.Color {
|
|
||||||
return DefaultCanvasStrokeColor
|
|
||||||
}
|
|
||||||
|
|
||||||
func (dp defaultColorPalette) AxisStrokeColor() drawing.Color {
|
|
||||||
return DefaultAxisColor
|
|
||||||
}
|
|
||||||
|
|
||||||
func (dp defaultColorPalette) TextColor() drawing.Color {
|
|
||||||
return DefaultTextColor
|
|
||||||
}
|
|
||||||
|
|
||||||
func (dp defaultColorPalette) GetSeriesColor(index int) drawing.Color {
|
|
||||||
return GetDefaultColor(index)
|
|
||||||
}
|
|
||||||
|
|
||||||
// AlternateColorPalette represents the default palatte.
|
|
||||||
var AlternateColorPalette alternateColorPalette
|
|
||||||
|
|
||||||
type alternateColorPalette struct{}
|
|
||||||
|
|
||||||
func (ap alternateColorPalette) BackgroundColor() drawing.Color {
|
|
||||||
return DefaultBackgroundColor
|
|
||||||
}
|
|
||||||
|
|
||||||
func (ap alternateColorPalette) BackgroundStrokeColor() drawing.Color {
|
|
||||||
return DefaultBackgroundStrokeColor
|
|
||||||
}
|
|
||||||
|
|
||||||
func (ap alternateColorPalette) CanvasColor() drawing.Color {
|
|
||||||
return DefaultCanvasColor
|
|
||||||
}
|
|
||||||
|
|
||||||
func (ap alternateColorPalette) CanvasStrokeColor() drawing.Color {
|
|
||||||
return DefaultCanvasStrokeColor
|
|
||||||
}
|
|
||||||
|
|
||||||
func (ap alternateColorPalette) AxisStrokeColor() drawing.Color {
|
|
||||||
return DefaultAxisColor
|
|
||||||
}
|
|
||||||
|
|
||||||
func (ap alternateColorPalette) TextColor() drawing.Color {
|
|
||||||
return DefaultTextColor
|
|
||||||
}
|
|
||||||
|
|
||||||
func (ap alternateColorPalette) GetSeriesColor(index int) drawing.Color {
|
|
||||||
return GetAlternateColor(index)
|
|
||||||
}
|
|
||||||
|
|
@ -7,7 +7,7 @@ type ConcatSeries []Series
|
||||||
func (cs ConcatSeries) Len() int {
|
func (cs ConcatSeries) Len() int {
|
||||||
total := 0
|
total := 0
|
||||||
for _, s := range cs {
|
for _, s := range cs {
|
||||||
if typed, isValuesProvider := s.(ValuesProvider); isValuesProvider {
|
if typed, isValueProvider := s.(ValueProvider); isValueProvider {
|
||||||
total += typed.Len()
|
total += typed.Len()
|
||||||
}
|
}
|
||||||
}
|
}
|
||||||
|
|
@ -19,10 +19,10 @@ func (cs ConcatSeries) Len() int {
|
||||||
func (cs ConcatSeries) GetValue(index int) (x, y float64) {
|
func (cs ConcatSeries) GetValue(index int) (x, y float64) {
|
||||||
cursor := 0
|
cursor := 0
|
||||||
for _, s := range cs {
|
for _, s := range cs {
|
||||||
if typed, isValuesProvider := s.(ValuesProvider); isValuesProvider {
|
if typed, isValueProvider := s.(ValueProvider); isValueProvider {
|
||||||
len := typed.Len()
|
len := typed.Len()
|
||||||
if index < cursor+len {
|
if index < cursor+len {
|
||||||
x, y = typed.GetValues(index - cursor) //FENCEPOSTS.
|
x, y = typed.GetValue(index - cursor) //FENCEPOSTS.
|
||||||
return
|
return
|
||||||
}
|
}
|
||||||
cursor += typed.Len()
|
cursor += typed.Len()
|
||||||
|
|
|
||||||
41
concat_series_test.go
Normal file
|
|
@ -0,0 +1,41 @@
|
||||||
|
package chart
|
||||||
|
|
||||||
|
import (
|
||||||
|
"testing"
|
||||||
|
|
||||||
|
assert "github.com/blendlabs/go-assert"
|
||||||
|
)
|
||||||
|
|
||||||
|
func TestConcatSeries(t *testing.T) {
|
||||||
|
assert := assert.New(t)
|
||||||
|
|
||||||
|
s1 := ContinuousSeries{
|
||||||
|
XValues: Sequence.Float64(1.0, 10.0),
|
||||||
|
YValues: Sequence.Float64(1.0, 10.0),
|
||||||
|
}
|
||||||
|
|
||||||
|
s2 := ContinuousSeries{
|
||||||
|
XValues: Sequence.Float64(11, 20.0),
|
||||||
|
YValues: Sequence.Float64(10.0, 1.0),
|
||||||
|
}
|
||||||
|
|
||||||
|
s3 := ContinuousSeries{
|
||||||
|
XValues: Sequence.Float64(21, 30.0),
|
||||||
|
YValues: Sequence.Float64(1.0, 10.0),
|
||||||
|
}
|
||||||
|
|
||||||
|
cs := ConcatSeries([]Series{s1, s2, s3})
|
||||||
|
assert.Equal(30, cs.Len())
|
||||||
|
|
||||||
|
x0, y0 := cs.GetValue(0)
|
||||||
|
assert.Equal(1.0, x0)
|
||||||
|
assert.Equal(1.0, y0)
|
||||||
|
|
||||||
|
xm, ym := cs.GetValue(19)
|
||||||
|
assert.Equal(20.0, xm)
|
||||||
|
assert.Equal(1.0, ym)
|
||||||
|
|
||||||
|
xn, yn := cs.GetValue(29)
|
||||||
|
assert.Equal(30.0, xn)
|
||||||
|
assert.Equal(10.0, yn)
|
||||||
|
}
|
||||||
22
continuous_range_test.go
Normal file
|
|
@ -0,0 +1,22 @@
|
||||||
|
package chart
|
||||||
|
|
||||||
|
import (
|
||||||
|
"testing"
|
||||||
|
|
||||||
|
"github.com/blendlabs/go-assert"
|
||||||
|
)
|
||||||
|
|
||||||
|
func TestRangeTranslate(t *testing.T) {
|
||||||
|
assert := assert.New(t)
|
||||||
|
values := []float64{1.0, 2.0, 2.5, 2.7, 3.0, 4.0, 5.0, 6.0, 7.0, 8.0}
|
||||||
|
r := ContinuousRange{Domain: 1000}
|
||||||
|
r.Min, r.Max = Math.MinAndMax(values...)
|
||||||
|
|
||||||
|
// delta = ~7.0
|
||||||
|
// value = ~5.0
|
||||||
|
// domain = ~1000
|
||||||
|
// 5/8 * 1000 ~=
|
||||||
|
assert.Equal(0, r.Translate(1.0))
|
||||||
|
assert.Equal(1000, r.Translate(8.0))
|
||||||
|
assert.Equal(572, r.Translate(5.0))
|
||||||
|
}
|
||||||
|
|
@ -2,13 +2,6 @@ package chart
|
||||||
|
|
||||||
import "fmt"
|
import "fmt"
|
||||||
|
|
||||||
// Interface Assertions.
|
|
||||||
var (
|
|
||||||
_ Series = (*ContinuousSeries)(nil)
|
|
||||||
_ FirstValuesProvider = (*ContinuousSeries)(nil)
|
|
||||||
_ LastValuesProvider = (*ContinuousSeries)(nil)
|
|
||||||
)
|
|
||||||
|
|
||||||
// ContinuousSeries represents a line on a chart.
|
// ContinuousSeries represents a line on a chart.
|
||||||
type ContinuousSeries struct {
|
type ContinuousSeries struct {
|
||||||
Name string
|
Name string
|
||||||
|
|
@ -38,18 +31,13 @@ func (cs ContinuousSeries) Len() int {
|
||||||
return len(cs.XValues)
|
return len(cs.XValues)
|
||||||
}
|
}
|
||||||
|
|
||||||
// GetValues gets the x,y values at a given index.
|
// GetValue gets a value at a given index.
|
||||||
func (cs ContinuousSeries) GetValues(index int) (float64, float64) {
|
func (cs ContinuousSeries) GetValue(index int) (float64, float64) {
|
||||||
return cs.XValues[index], cs.YValues[index]
|
return cs.XValues[index], cs.YValues[index]
|
||||||
}
|
}
|
||||||
|
|
||||||
// GetFirstValues gets the first x,y values.
|
// GetLastValue gets the last value.
|
||||||
func (cs ContinuousSeries) GetFirstValues() (float64, float64) {
|
func (cs ContinuousSeries) GetLastValue() (float64, float64) {
|
||||||
return cs.XValues[0], cs.YValues[0]
|
|
||||||
}
|
|
||||||
|
|
||||||
// GetLastValues gets the last x,y values.
|
|
||||||
func (cs ContinuousSeries) GetLastValues() (float64, float64) {
|
|
||||||
return cs.XValues[len(cs.XValues)-1], cs.YValues[len(cs.YValues)-1]
|
return cs.XValues[len(cs.XValues)-1], cs.YValues[len(cs.YValues)-1]
|
||||||
}
|
}
|
||||||
|
|
||||||
|
|
|
||||||
72
continuous_series_test.go
Normal file
|
|
@ -0,0 +1,72 @@
|
||||||
|
package chart
|
||||||
|
|
||||||
|
import (
|
||||||
|
"fmt"
|
||||||
|
"testing"
|
||||||
|
|
||||||
|
assert "github.com/blendlabs/go-assert"
|
||||||
|
)
|
||||||
|
|
||||||
|
func TestContinuousSeries(t *testing.T) {
|
||||||
|
assert := assert.New(t)
|
||||||
|
|
||||||
|
cs := ContinuousSeries{
|
||||||
|
Name: "Test Series",
|
||||||
|
XValues: Sequence.Float64(1.0, 10.0),
|
||||||
|
YValues: Sequence.Float64(1.0, 10.0),
|
||||||
|
}
|
||||||
|
|
||||||
|
assert.Equal("Test Series", cs.GetName())
|
||||||
|
assert.Equal(10, cs.Len())
|
||||||
|
x0, y0 := cs.GetValue(0)
|
||||||
|
assert.Equal(1.0, x0)
|
||||||
|
assert.Equal(1.0, y0)
|
||||||
|
|
||||||
|
xn, yn := cs.GetValue(9)
|
||||||
|
assert.Equal(10.0, xn)
|
||||||
|
assert.Equal(10.0, yn)
|
||||||
|
|
||||||
|
xn, yn = cs.GetLastValue()
|
||||||
|
assert.Equal(10.0, xn)
|
||||||
|
assert.Equal(10.0, yn)
|
||||||
|
}
|
||||||
|
|
||||||
|
func TestContinuousSeriesValueFormatter(t *testing.T) {
|
||||||
|
assert := assert.New(t)
|
||||||
|
|
||||||
|
cs := ContinuousSeries{
|
||||||
|
XValueFormatter: func(v interface{}) string {
|
||||||
|
return fmt.Sprintf("%f foo", v)
|
||||||
|
},
|
||||||
|
YValueFormatter: func(v interface{}) string {
|
||||||
|
return fmt.Sprintf("%f bar", v)
|
||||||
|
},
|
||||||
|
}
|
||||||
|
|
||||||
|
xf, yf := cs.GetValueFormatters()
|
||||||
|
assert.Equal("0.100000 foo", xf(0.1))
|
||||||
|
assert.Equal("0.100000 bar", yf(0.1))
|
||||||
|
}
|
||||||
|
|
||||||
|
func TestContinuousSeriesValidate(t *testing.T) {
|
||||||
|
assert := assert.New(t)
|
||||||
|
|
||||||
|
cs := ContinuousSeries{
|
||||||
|
Name: "Test Series",
|
||||||
|
XValues: Sequence.Float64(1.0, 10.0),
|
||||||
|
YValues: Sequence.Float64(1.0, 10.0),
|
||||||
|
}
|
||||||
|
assert.Nil(cs.Validate())
|
||||||
|
|
||||||
|
cs = ContinuousSeries{
|
||||||
|
Name: "Test Series",
|
||||||
|
XValues: Sequence.Float64(1.0, 10.0),
|
||||||
|
}
|
||||||
|
assert.NotNil(cs.Validate())
|
||||||
|
|
||||||
|
cs = ContinuousSeries{
|
||||||
|
Name: "Test Series",
|
||||||
|
YValues: Sequence.Float64(1.0, 10.0),
|
||||||
|
}
|
||||||
|
assert.NotNil(cs.Validate())
|
||||||
|
}
|
||||||
426
date.go
Normal file
|
|
@ -0,0 +1,426 @@
|
||||||
|
package chart
|
||||||
|
|
||||||
|
import (
|
||||||
|
"sync"
|
||||||
|
"time"
|
||||||
|
)
|
||||||
|
|
||||||
|
const (
|
||||||
|
// AllDaysMask is a bitmask of all the days of the week.
|
||||||
|
AllDaysMask = 1<<uint(time.Sunday) | 1<<uint(time.Monday) | 1<<uint(time.Tuesday) | 1<<uint(time.Wednesday) | 1<<uint(time.Thursday) | 1<<uint(time.Friday) | 1<<uint(time.Saturday)
|
||||||
|
// WeekDaysMask is a bitmask of all the weekdays of the week.
|
||||||
|
WeekDaysMask = 1<<uint(time.Monday) | 1<<uint(time.Tuesday) | 1<<uint(time.Wednesday) | 1<<uint(time.Thursday) | 1<<uint(time.Friday)
|
||||||
|
//WeekendDaysMask is a bitmask of the weekend days of the week.
|
||||||
|
WeekendDaysMask = 1<<uint(time.Sunday) | 1<<uint(time.Saturday)
|
||||||
|
)
|
||||||
|
|
||||||
|
var (
|
||||||
|
// DaysOfWeek are all the time.Weekday in an array for utility purposes.
|
||||||
|
DaysOfWeek = []time.Weekday{
|
||||||
|
time.Sunday,
|
||||||
|
time.Monday,
|
||||||
|
time.Tuesday,
|
||||||
|
time.Wednesday,
|
||||||
|
time.Thursday,
|
||||||
|
time.Friday,
|
||||||
|
time.Saturday,
|
||||||
|
}
|
||||||
|
|
||||||
|
// WeekDays are the business time.Weekday in an array.
|
||||||
|
WeekDays = []time.Weekday{
|
||||||
|
time.Monday,
|
||||||
|
time.Tuesday,
|
||||||
|
time.Wednesday,
|
||||||
|
time.Thursday,
|
||||||
|
time.Friday,
|
||||||
|
}
|
||||||
|
|
||||||
|
// WeekendDays are the weekend time.Weekday in an array.
|
||||||
|
WeekendDays = []time.Weekday{
|
||||||
|
time.Sunday,
|
||||||
|
time.Saturday,
|
||||||
|
}
|
||||||
|
|
||||||
|
//Epoch is unix epoc saved for utility purposes.
|
||||||
|
Epoch = time.Unix(0, 0)
|
||||||
|
)
|
||||||
|
|
||||||
|
var (
|
||||||
|
_easternLock sync.Mutex
|
||||||
|
_eastern *time.Location
|
||||||
|
)
|
||||||
|
|
||||||
|
// NYSEOpen is when the NYSE opens.
|
||||||
|
func NYSEOpen() time.Time { return Date.Time(9, 30, 0, 0, Date.Eastern()) }
|
||||||
|
|
||||||
|
// NYSEClose is when the NYSE closes.
|
||||||
|
func NYSEClose() time.Time { return Date.Time(16, 0, 0, 0, Date.Eastern()) }
|
||||||
|
|
||||||
|
// NASDAQOpen is when NASDAQ opens.
|
||||||
|
func NASDAQOpen() time.Time { return Date.Time(9, 30, 0, 0, Date.Eastern()) }
|
||||||
|
|
||||||
|
// NASDAQClose is when NASDAQ closes.
|
||||||
|
func NASDAQClose() time.Time { return Date.Time(16, 0, 0, 0, Date.Eastern()) }
|
||||||
|
|
||||||
|
// NYSEArcaOpen is when NYSEARCA opens.
|
||||||
|
func NYSEArcaOpen() time.Time { return Date.Time(4, 0, 0, 0, Date.Eastern()) }
|
||||||
|
|
||||||
|
// NYSEArcaClose is when NYSEARCA closes.
|
||||||
|
func NYSEArcaClose() time.Time { return Date.Time(20, 0, 0, 0, Date.Eastern()) }
|
||||||
|
|
||||||
|
// HolidayProvider is a function that returns if a given time falls on a holiday.
|
||||||
|
type HolidayProvider func(time.Time) bool
|
||||||
|
|
||||||
|
// defaultHolidayProvider implements `HolidayProvider` and just returns false.
|
||||||
|
func defaultHolidayProvider(_ time.Time) bool { return false }
|
||||||
|
|
||||||
|
var (
|
||||||
|
// Date contains utility functions that operate on dates.
|
||||||
|
Date = &date{}
|
||||||
|
)
|
||||||
|
|
||||||
|
type date struct{}
|
||||||
|
|
||||||
|
// IsNYSEHoliday returns if a date was/is on a nyse holiday day.
|
||||||
|
func (d date) IsNYSEHoliday(t time.Time) bool {
|
||||||
|
te := t.In(d.Eastern())
|
||||||
|
if te.Year() == 2013 {
|
||||||
|
if te.Month() == 1 {
|
||||||
|
return te.Day() == 1 || te.Day() == 21
|
||||||
|
} else if te.Month() == 2 {
|
||||||
|
return te.Day() == 18
|
||||||
|
} else if te.Month() == 3 {
|
||||||
|
return te.Day() == 29
|
||||||
|
} else if te.Month() == 5 {
|
||||||
|
return te.Day() == 27
|
||||||
|
} else if te.Month() == 7 {
|
||||||
|
return te.Day() == 4
|
||||||
|
} else if te.Month() == 9 {
|
||||||
|
return te.Day() == 2
|
||||||
|
} else if te.Month() == 11 {
|
||||||
|
return te.Day() == 28
|
||||||
|
} else if te.Month() == 12 {
|
||||||
|
return te.Day() == 25
|
||||||
|
}
|
||||||
|
} else if te.Year() == 2014 {
|
||||||
|
if te.Month() == 1 {
|
||||||
|
return te.Day() == 1 || te.Day() == 20
|
||||||
|
} else if te.Month() == 2 {
|
||||||
|
return te.Day() == 17
|
||||||
|
} else if te.Month() == 4 {
|
||||||
|
return te.Day() == 18
|
||||||
|
} else if te.Month() == 5 {
|
||||||
|
return te.Day() == 26
|
||||||
|
} else if te.Month() == 7 {
|
||||||
|
return te.Day() == 4
|
||||||
|
} else if te.Month() == 9 {
|
||||||
|
return te.Day() == 1
|
||||||
|
} else if te.Month() == 11 {
|
||||||
|
return te.Day() == 27
|
||||||
|
} else if te.Month() == 12 {
|
||||||
|
return te.Day() == 25
|
||||||
|
}
|
||||||
|
} else if te.Year() == 2015 {
|
||||||
|
if te.Month() == 1 {
|
||||||
|
return te.Day() == 1 || te.Day() == 19
|
||||||
|
} else if te.Month() == 2 {
|
||||||
|
return te.Day() == 16
|
||||||
|
} else if te.Month() == 4 {
|
||||||
|
return te.Day() == 3
|
||||||
|
} else if te.Month() == 5 {
|
||||||
|
return te.Day() == 25
|
||||||
|
} else if te.Month() == 7 {
|
||||||
|
return te.Day() == 3
|
||||||
|
} else if te.Month() == 9 {
|
||||||
|
return te.Day() == 7
|
||||||
|
} else if te.Month() == 11 {
|
||||||
|
return te.Day() == 26
|
||||||
|
} else if te.Month() == 12 {
|
||||||
|
return te.Day() == 25
|
||||||
|
}
|
||||||
|
} else if te.Year() == 2016 {
|
||||||
|
if te.Month() == 1 {
|
||||||
|
return te.Day() == 1 || te.Day() == 18
|
||||||
|
} else if te.Month() == 2 {
|
||||||
|
return te.Day() == 15
|
||||||
|
} else if te.Month() == 3 {
|
||||||
|
return te.Day() == 25
|
||||||
|
} else if te.Month() == 5 {
|
||||||
|
return te.Day() == 30
|
||||||
|
} else if te.Month() == 7 {
|
||||||
|
return te.Day() == 4
|
||||||
|
} else if te.Month() == 9 {
|
||||||
|
return te.Day() == 5
|
||||||
|
} else if te.Month() == 11 {
|
||||||
|
return te.Day() == 24 || te.Day() == 25
|
||||||
|
} else if te.Month() == 12 {
|
||||||
|
return te.Day() == 26
|
||||||
|
}
|
||||||
|
} else if te.Year() == 2017 {
|
||||||
|
if te.Month() == 1 {
|
||||||
|
return te.Day() == 1 || te.Day() == 16
|
||||||
|
} else if te.Month() == 2 {
|
||||||
|
return te.Day() == 20
|
||||||
|
} else if te.Month() == 4 {
|
||||||
|
return te.Day() == 15
|
||||||
|
} else if te.Month() == 5 {
|
||||||
|
return te.Day() == 29
|
||||||
|
} else if te.Month() == 7 {
|
||||||
|
return te.Day() == 4
|
||||||
|
} else if te.Month() == 9 {
|
||||||
|
return te.Day() == 4
|
||||||
|
} else if te.Month() == 11 {
|
||||||
|
return te.Day() == 23
|
||||||
|
} else if te.Month() == 12 {
|
||||||
|
return te.Day() == 25
|
||||||
|
}
|
||||||
|
} else if te.Year() == 2018 {
|
||||||
|
if te.Month() == 1 {
|
||||||
|
return te.Day() == 1 || te.Day() == 15
|
||||||
|
} else if te.Month() == 2 {
|
||||||
|
return te.Day() == 19
|
||||||
|
} else if te.Month() == 3 {
|
||||||
|
return te.Day() == 30
|
||||||
|
} else if te.Month() == 5 {
|
||||||
|
return te.Day() == 28
|
||||||
|
} else if te.Month() == 7 {
|
||||||
|
return te.Day() == 4
|
||||||
|
} else if te.Month() == 9 {
|
||||||
|
return te.Day() == 3
|
||||||
|
} else if te.Month() == 11 {
|
||||||
|
return te.Day() == 22
|
||||||
|
} else if te.Month() == 12 {
|
||||||
|
return te.Day() == 25
|
||||||
|
}
|
||||||
|
}
|
||||||
|
return false
|
||||||
|
}
|
||||||
|
|
||||||
|
// IsNYSEArcaHoliday returns that returns if a given time falls on a holiday.
|
||||||
|
func (d date) IsNYSEArcaHoliday(t time.Time) bool {
|
||||||
|
return d.IsNYSEHoliday(t)
|
||||||
|
}
|
||||||
|
|
||||||
|
// IsNASDAQHoliday returns if a date was a NASDAQ holiday day.
|
||||||
|
func (d date) IsNASDAQHoliday(t time.Time) bool {
|
||||||
|
return d.IsNYSEHoliday(t)
|
||||||
|
}
|
||||||
|
|
||||||
|
// Time returns a new time.Time for the given clock components.
|
||||||
|
func (d date) Time(hour, min, sec, nsec int, loc *time.Location) time.Time {
|
||||||
|
return time.Date(0, 0, 0, hour, min, sec, nsec, loc)
|
||||||
|
}
|
||||||
|
|
||||||
|
func (d date) Date(year, month, day int, loc *time.Location) time.Time {
|
||||||
|
return time.Date(year, time.Month(month), day, 12, 0, 0, 0, loc)
|
||||||
|
}
|
||||||
|
|
||||||
|
// On returns the clock components of clock (hour,minute,second) on the date components of d.
|
||||||
|
func (d date) On(clock, cd time.Time) time.Time {
|
||||||
|
tzAdjusted := cd.In(clock.Location())
|
||||||
|
return time.Date(tzAdjusted.Year(), tzAdjusted.Month(), tzAdjusted.Day(), clock.Hour(), clock.Minute(), clock.Second(), clock.Nanosecond(), clock.Location())
|
||||||
|
}
|
||||||
|
|
||||||
|
// NoonOn is a shortcut for On(Time(12,0,0), cd) a.k.a. noon on a given date.
|
||||||
|
func (d date) NoonOn(cd time.Time) time.Time {
|
||||||
|
return time.Date(cd.Year(), cd.Month(), cd.Day(), 12, 0, 0, 0, cd.Location())
|
||||||
|
}
|
||||||
|
|
||||||
|
// Optional returns a pointer reference to a given time.
|
||||||
|
func (d date) Optional(t time.Time) *time.Time {
|
||||||
|
return &t
|
||||||
|
}
|
||||||
|
|
||||||
|
// IsWeekDay returns if the day is a monday->friday.
|
||||||
|
func (d date) IsWeekDay(day time.Weekday) bool {
|
||||||
|
return !d.IsWeekendDay(day)
|
||||||
|
}
|
||||||
|
|
||||||
|
// IsWeekendDay returns if the day is a monday->friday.
|
||||||
|
func (d date) IsWeekendDay(day time.Weekday) bool {
|
||||||
|
return day == time.Saturday || day == time.Sunday
|
||||||
|
}
|
||||||
|
|
||||||
|
// Before returns if a timestamp is strictly before another date (ignoring hours, minutes etc.)
|
||||||
|
func (d date) Before(before, reference time.Time) bool {
|
||||||
|
tzAdjustedBefore := before.In(reference.Location())
|
||||||
|
if tzAdjustedBefore.Year() < reference.Year() {
|
||||||
|
return true
|
||||||
|
}
|
||||||
|
if tzAdjustedBefore.Month() < reference.Month() {
|
||||||
|
return true
|
||||||
|
}
|
||||||
|
return tzAdjustedBefore.Year() == reference.Year() && tzAdjustedBefore.Month() == reference.Month() && tzAdjustedBefore.Day() < reference.Day()
|
||||||
|
}
|
||||||
|
|
||||||
|
// NextMarketOpen returns the next market open after a given time.
|
||||||
|
func (d date) NextMarketOpen(after, openTime time.Time, isHoliday HolidayProvider) time.Time {
|
||||||
|
afterLocalized := after.In(openTime.Location())
|
||||||
|
todaysOpen := d.On(openTime, afterLocalized)
|
||||||
|
|
||||||
|
if isHoliday == nil {
|
||||||
|
isHoliday = defaultHolidayProvider
|
||||||
|
}
|
||||||
|
|
||||||
|
todayIsValidTradingDay := d.IsWeekDay(todaysOpen.Weekday()) && !isHoliday(todaysOpen)
|
||||||
|
|
||||||
|
if (afterLocalized.Equal(todaysOpen) || afterLocalized.Before(todaysOpen)) && todayIsValidTradingDay {
|
||||||
|
return todaysOpen
|
||||||
|
}
|
||||||
|
|
||||||
|
for cursorDay := 1; cursorDay < 7; cursorDay++ {
|
||||||
|
newDay := todaysOpen.AddDate(0, 0, cursorDay)
|
||||||
|
isValidTradingDay := d.IsWeekDay(newDay.Weekday()) && !isHoliday(newDay)
|
||||||
|
if isValidTradingDay {
|
||||||
|
return d.On(openTime, newDay)
|
||||||
|
}
|
||||||
|
}
|
||||||
|
panic("Have exhausted day window looking for next market open.")
|
||||||
|
}
|
||||||
|
|
||||||
|
// NextMarketClose returns the next market close after a given time.
|
||||||
|
func (d date) NextMarketClose(after, closeTime time.Time, isHoliday HolidayProvider) time.Time {
|
||||||
|
afterLocalized := after.In(closeTime.Location())
|
||||||
|
|
||||||
|
if isHoliday == nil {
|
||||||
|
isHoliday = defaultHolidayProvider
|
||||||
|
}
|
||||||
|
|
||||||
|
todaysClose := d.On(closeTime, afterLocalized)
|
||||||
|
if afterLocalized.Before(todaysClose) && d.IsWeekDay(todaysClose.Weekday()) && !isHoliday(todaysClose) {
|
||||||
|
return todaysClose
|
||||||
|
}
|
||||||
|
|
||||||
|
if afterLocalized.Equal(todaysClose) { //rare but it might happen.
|
||||||
|
return todaysClose
|
||||||
|
}
|
||||||
|
|
||||||
|
for cursorDay := 1; cursorDay < 6; cursorDay++ {
|
||||||
|
newDay := todaysClose.AddDate(0, 0, cursorDay)
|
||||||
|
if d.IsWeekDay(newDay.Weekday()) && !isHoliday(newDay) {
|
||||||
|
return d.On(closeTime, newDay)
|
||||||
|
}
|
||||||
|
}
|
||||||
|
panic("Have exhausted day window looking for next market close.")
|
||||||
|
}
|
||||||
|
|
||||||
|
// CalculateMarketSecondsBetween calculates the number of seconds the market was open between two dates.
|
||||||
|
func (d date) CalculateMarketSecondsBetween(start, end, marketOpen, marketClose time.Time, isHoliday HolidayProvider) (seconds int64) {
|
||||||
|
startEastern := start.In(d.Eastern())
|
||||||
|
endEastern := end.In(d.Eastern())
|
||||||
|
|
||||||
|
startMarketOpen := d.On(marketOpen, startEastern)
|
||||||
|
startMarketClose := d.On(marketClose, startEastern)
|
||||||
|
|
||||||
|
if !d.IsWeekendDay(startMarketOpen.Weekday()) && !isHoliday(startMarketOpen) {
|
||||||
|
if (startEastern.Equal(startMarketOpen) || startEastern.After(startMarketOpen)) && startEastern.Before(startMarketClose) {
|
||||||
|
if endEastern.Before(startMarketClose) {
|
||||||
|
seconds += int64(endEastern.Sub(startEastern) / time.Second)
|
||||||
|
} else {
|
||||||
|
seconds += int64(startMarketClose.Sub(startEastern) / time.Second)
|
||||||
|
}
|
||||||
|
}
|
||||||
|
}
|
||||||
|
|
||||||
|
cursor := d.NextMarketOpen(startMarketClose, marketOpen, isHoliday)
|
||||||
|
for d.Before(cursor, endEastern) {
|
||||||
|
if d.IsWeekDay(cursor.Weekday()) && !isHoliday(cursor) {
|
||||||
|
close := d.NextMarketClose(cursor, marketClose, isHoliday)
|
||||||
|
seconds += int64(close.Sub(cursor) / time.Second)
|
||||||
|
}
|
||||||
|
cursor = cursor.AddDate(0, 0, 1)
|
||||||
|
}
|
||||||
|
|
||||||
|
finalMarketOpen := d.NextMarketOpen(cursor, marketOpen, isHoliday)
|
||||||
|
finalMarketClose := d.NextMarketClose(cursor, marketClose, isHoliday)
|
||||||
|
if endEastern.After(finalMarketOpen) {
|
||||||
|
if endEastern.Before(finalMarketClose) {
|
||||||
|
seconds += int64(endEastern.Sub(finalMarketOpen) / time.Second)
|
||||||
|
} else {
|
||||||
|
seconds += int64(finalMarketClose.Sub(finalMarketOpen) / time.Second)
|
||||||
|
}
|
||||||
|
}
|
||||||
|
|
||||||
|
return
|
||||||
|
}
|
||||||
|
|
||||||
|
const (
|
||||||
|
_secondsPerHour = 60 * 60
|
||||||
|
_secondsPerDay = 60 * 60 * 24
|
||||||
|
)
|
||||||
|
|
||||||
|
func (d date) DiffDays(t1, t2 time.Time) (days int) {
|
||||||
|
t1n := t1.Unix()
|
||||||
|
t2n := t2.Unix()
|
||||||
|
diff := t2n - t1n //yields seconds
|
||||||
|
return int(diff / (_secondsPerDay))
|
||||||
|
}
|
||||||
|
|
||||||
|
func (d date) DiffHours(t1, t2 time.Time) (hours int) {
|
||||||
|
t1n := t1.Unix()
|
||||||
|
t2n := t2.Unix()
|
||||||
|
diff := t2n - t1n //yields seconds
|
||||||
|
return int(diff / (_secondsPerHour))
|
||||||
|
}
|
||||||
|
|
||||||
|
// NextDay returns the timestamp advanced a day.
|
||||||
|
func (d date) NextDay(ts time.Time) time.Time {
|
||||||
|
return ts.AddDate(0, 0, 1)
|
||||||
|
}
|
||||||
|
|
||||||
|
// NextHour returns the next timestamp on the hour.
|
||||||
|
func (d date) NextHour(ts time.Time) time.Time {
|
||||||
|
//advance a full hour ...
|
||||||
|
advanced := ts.Add(time.Hour)
|
||||||
|
minutes := time.Duration(advanced.Minute()) * time.Minute
|
||||||
|
final := advanced.Add(-minutes)
|
||||||
|
return time.Date(final.Year(), final.Month(), final.Day(), final.Hour(), 0, 0, 0, final.Location())
|
||||||
|
}
|
||||||
|
|
||||||
|
// NextDayOfWeek returns the next instance of a given weekday after a given timestamp.
|
||||||
|
func (d date) NextDayOfWeek(after time.Time, dayOfWeek time.Weekday) time.Time {
|
||||||
|
afterWeekday := after.Weekday()
|
||||||
|
if afterWeekday == dayOfWeek {
|
||||||
|
return after.AddDate(0, 0, 7)
|
||||||
|
}
|
||||||
|
|
||||||
|
// 1 vs 5 ~ add 4 days
|
||||||
|
if afterWeekday < dayOfWeek {
|
||||||
|
dayDelta := int(dayOfWeek - afterWeekday)
|
||||||
|
return after.AddDate(0, 0, dayDelta)
|
||||||
|
}
|
||||||
|
|
||||||
|
// 5 vs 1, add 7-(5-1) ~ 3 days
|
||||||
|
dayDelta := 7 - int(afterWeekday-dayOfWeek)
|
||||||
|
return after.AddDate(0, 0, dayDelta)
|
||||||
|
}
|
||||||
|
|
||||||
|
// Start returns the earliest (min) time in a list of times.
|
||||||
|
func (d date) Start(times []time.Time) time.Time {
|
||||||
|
if len(times) == 0 {
|
||||||
|
return time.Time{}
|
||||||
|
}
|
||||||
|
|
||||||
|
start := times[0]
|
||||||
|
for _, t := range times[1:] {
|
||||||
|
if t.Before(start) {
|
||||||
|
start = t
|
||||||
|
}
|
||||||
|
}
|
||||||
|
return start
|
||||||
|
}
|
||||||
|
|
||||||
|
// Start returns the earliest (min) time in a list of times.
|
||||||
|
func (d date) End(times []time.Time) time.Time {
|
||||||
|
if len(times) == 0 {
|
||||||
|
return time.Time{}
|
||||||
|
}
|
||||||
|
|
||||||
|
end := times[0]
|
||||||
|
for _, t := range times[1:] {
|
||||||
|
if t.After(end) {
|
||||||
|
end = t
|
||||||
|
}
|
||||||
|
}
|
||||||
|
return end
|
||||||
|
}
|
||||||
17
date_posix.go
Normal file
|
|
@ -0,0 +1,17 @@
|
||||||
|
// +build !windows
|
||||||
|
|
||||||
|
package chart
|
||||||
|
|
||||||
|
import "time"
|
||||||
|
|
||||||
|
// Eastern returns the eastern timezone.
|
||||||
|
func (d date) Eastern() *time.Location {
|
||||||
|
if _eastern == nil {
|
||||||
|
_easternLock.Lock()
|
||||||
|
defer _easternLock.Unlock()
|
||||||
|
if _eastern == nil {
|
||||||
|
_eastern, _ = time.LoadLocation("America/New_York")
|
||||||
|
}
|
||||||
|
}
|
||||||
|
return _eastern
|
||||||
|
}
|
||||||
288
date_test.go
Normal file
|
|
@ -0,0 +1,288 @@
|
||||||
|
package chart
|
||||||
|
|
||||||
|
import (
|
||||||
|
"testing"
|
||||||
|
"time"
|
||||||
|
|
||||||
|
assert "github.com/blendlabs/go-assert"
|
||||||
|
)
|
||||||
|
|
||||||
|
func parse(v string) time.Time {
|
||||||
|
ts, _ := time.Parse("2006-01-02", v)
|
||||||
|
return ts
|
||||||
|
}
|
||||||
|
|
||||||
|
func TestDateTime(t *testing.T) {
|
||||||
|
assert := assert.New(t)
|
||||||
|
|
||||||
|
ts := Date.Time(5, 6, 7, 8, time.UTC)
|
||||||
|
assert.Equal(05, ts.Hour())
|
||||||
|
assert.Equal(06, ts.Minute())
|
||||||
|
assert.Equal(07, ts.Second())
|
||||||
|
assert.Equal(8, ts.Nanosecond())
|
||||||
|
assert.Equal(time.UTC, ts.Location())
|
||||||
|
}
|
||||||
|
|
||||||
|
func TestDateDate(t *testing.T) {
|
||||||
|
assert := assert.New(t)
|
||||||
|
|
||||||
|
ts := Date.Date(2015, 5, 6, time.UTC)
|
||||||
|
assert.Equal(2015, ts.Year())
|
||||||
|
assert.Equal(5, ts.Month())
|
||||||
|
assert.Equal(6, ts.Day())
|
||||||
|
assert.Equal(time.UTC, ts.Location())
|
||||||
|
}
|
||||||
|
|
||||||
|
func TestDateOn(t *testing.T) {
|
||||||
|
assert := assert.New(t)
|
||||||
|
|
||||||
|
ts := Date.On(Date.Time(5, 4, 3, 2, time.UTC), Date.Date(2016, 6, 7, Date.Eastern()))
|
||||||
|
assert.Equal(2016, ts.Year())
|
||||||
|
assert.Equal(6, ts.Month())
|
||||||
|
assert.Equal(7, ts.Day())
|
||||||
|
assert.Equal(5, ts.Hour())
|
||||||
|
assert.Equal(4, ts.Minute())
|
||||||
|
assert.Equal(3, ts.Second())
|
||||||
|
assert.Equal(2, ts.Nanosecond())
|
||||||
|
assert.Equal(time.UTC, ts.Location())
|
||||||
|
}
|
||||||
|
|
||||||
|
func TestDateNoonOn(t *testing.T) {
|
||||||
|
assert := assert.New(t)
|
||||||
|
noon := Date.NoonOn(time.Date(2016, 04, 03, 02, 01, 0, 0, time.UTC))
|
||||||
|
|
||||||
|
assert.Equal(2016, noon.Year())
|
||||||
|
assert.Equal(4, noon.Month())
|
||||||
|
assert.Equal(3, noon.Day())
|
||||||
|
assert.Equal(12, noon.Hour())
|
||||||
|
assert.Equal(0, noon.Minute())
|
||||||
|
assert.Equal(time.UTC, noon.Location())
|
||||||
|
}
|
||||||
|
|
||||||
|
func TestDateBefore(t *testing.T) {
|
||||||
|
assert := assert.New(t)
|
||||||
|
|
||||||
|
assert.True(Date.Before(parse("2015-07-02"), parse("2016-07-01")))
|
||||||
|
assert.True(Date.Before(parse("2016-06-01"), parse("2016-07-01")))
|
||||||
|
assert.True(Date.Before(parse("2016-07-01"), parse("2016-07-02")))
|
||||||
|
|
||||||
|
assert.False(Date.Before(parse("2016-07-01"), parse("2016-07-01")))
|
||||||
|
assert.False(Date.Before(parse("2016-07-03"), parse("2016-07-01")))
|
||||||
|
assert.False(Date.Before(parse("2016-08-03"), parse("2016-07-01")))
|
||||||
|
assert.False(Date.Before(parse("2017-08-03"), parse("2016-07-01")))
|
||||||
|
}
|
||||||
|
|
||||||
|
func TestDateBeforeHandlesTimezones(t *testing.T) {
|
||||||
|
assert := assert.New(t)
|
||||||
|
|
||||||
|
tuesdayUTC := time.Date(2016, 8, 02, 22, 00, 0, 0, time.UTC)
|
||||||
|
mondayUTC := time.Date(2016, 8, 01, 1, 00, 0, 0, time.UTC)
|
||||||
|
sundayEST := time.Date(2016, 7, 31, 22, 00, 0, 0, Date.Eastern())
|
||||||
|
|
||||||
|
assert.True(Date.Before(sundayEST, tuesdayUTC))
|
||||||
|
assert.False(Date.Before(sundayEST, mondayUTC))
|
||||||
|
}
|
||||||
|
|
||||||
|
func TestNextMarketOpen(t *testing.T) {
|
||||||
|
assert := assert.New(t)
|
||||||
|
|
||||||
|
beforeOpen := time.Date(2016, 07, 18, 9, 0, 0, 0, Date.Eastern())
|
||||||
|
todayOpen := time.Date(2016, 07, 18, 9, 30, 0, 0, Date.Eastern())
|
||||||
|
|
||||||
|
afterOpen := time.Date(2016, 07, 18, 9, 31, 0, 0, Date.Eastern())
|
||||||
|
tomorrowOpen := time.Date(2016, 07, 19, 9, 30, 0, 0, Date.Eastern())
|
||||||
|
|
||||||
|
afterFriday := time.Date(2016, 07, 22, 9, 31, 0, 0, Date.Eastern())
|
||||||
|
mondayOpen := time.Date(2016, 07, 25, 9, 30, 0, 0, Date.Eastern())
|
||||||
|
|
||||||
|
weekend := time.Date(2016, 07, 23, 9, 31, 0, 0, Date.Eastern())
|
||||||
|
|
||||||
|
assert.True(todayOpen.Equal(Date.NextMarketOpen(beforeOpen, NYSEOpen(), Date.IsNYSEHoliday)))
|
||||||
|
assert.True(tomorrowOpen.Equal(Date.NextMarketOpen(afterOpen, NYSEOpen(), Date.IsNYSEHoliday)))
|
||||||
|
assert.True(mondayOpen.Equal(Date.NextMarketOpen(afterFriday, NYSEOpen(), Date.IsNYSEHoliday)))
|
||||||
|
assert.True(mondayOpen.Equal(Date.NextMarketOpen(weekend, NYSEOpen(), Date.IsNYSEHoliday)))
|
||||||
|
|
||||||
|
assert.Equal(Date.Eastern(), todayOpen.Location())
|
||||||
|
assert.Equal(Date.Eastern(), tomorrowOpen.Location())
|
||||||
|
assert.Equal(Date.Eastern(), mondayOpen.Location())
|
||||||
|
|
||||||
|
testRegression := time.Date(2016, 07, 18, 16, 0, 0, 0, Date.Eastern())
|
||||||
|
shouldbe := time.Date(2016, 07, 19, 9, 30, 0, 0, Date.Eastern())
|
||||||
|
|
||||||
|
assert.True(shouldbe.Equal(Date.NextMarketOpen(testRegression, NYSEOpen(), Date.IsNYSEHoliday)))
|
||||||
|
}
|
||||||
|
|
||||||
|
func TestNextMarketClose(t *testing.T) {
|
||||||
|
assert := assert.New(t)
|
||||||
|
|
||||||
|
beforeClose := time.Date(2016, 07, 18, 15, 0, 0, 0, Date.Eastern())
|
||||||
|
todayClose := time.Date(2016, 07, 18, 16, 00, 0, 0, Date.Eastern())
|
||||||
|
|
||||||
|
afterClose := time.Date(2016, 07, 18, 16, 1, 0, 0, Date.Eastern())
|
||||||
|
tomorrowClose := time.Date(2016, 07, 19, 16, 00, 0, 0, Date.Eastern())
|
||||||
|
|
||||||
|
afterFriday := time.Date(2016, 07, 22, 16, 1, 0, 0, Date.Eastern())
|
||||||
|
mondayClose := time.Date(2016, 07, 25, 16, 0, 0, 0, Date.Eastern())
|
||||||
|
|
||||||
|
weekend := time.Date(2016, 07, 23, 9, 31, 0, 0, Date.Eastern())
|
||||||
|
|
||||||
|
assert.True(todayClose.Equal(Date.NextMarketClose(beforeClose, NYSEClose(), Date.IsNYSEHoliday)))
|
||||||
|
assert.True(tomorrowClose.Equal(Date.NextMarketClose(afterClose, NYSEClose(), Date.IsNYSEHoliday)))
|
||||||
|
assert.True(mondayClose.Equal(Date.NextMarketClose(afterFriday, NYSEClose(), Date.IsNYSEHoliday)))
|
||||||
|
assert.True(mondayClose.Equal(Date.NextMarketClose(weekend, NYSEClose(), Date.IsNYSEHoliday)))
|
||||||
|
|
||||||
|
assert.Equal(Date.Eastern(), todayClose.Location())
|
||||||
|
assert.Equal(Date.Eastern(), tomorrowClose.Location())
|
||||||
|
assert.Equal(Date.Eastern(), mondayClose.Location())
|
||||||
|
}
|
||||||
|
|
||||||
|
func TestCalculateMarketSecondsBetween(t *testing.T) {
|
||||||
|
assert := assert.New(t)
|
||||||
|
|
||||||
|
start := time.Date(2016, 07, 18, 9, 30, 0, 0, Date.Eastern())
|
||||||
|
end := time.Date(2016, 07, 22, 16, 00, 0, 0, Date.Eastern())
|
||||||
|
|
||||||
|
shouldbe := 5 * 6.5 * 60 * 60
|
||||||
|
|
||||||
|
assert.Equal(shouldbe, Date.CalculateMarketSecondsBetween(start, end, NYSEOpen(), NYSEClose(), Date.IsNYSEHoliday))
|
||||||
|
}
|
||||||
|
|
||||||
|
func TestCalculateMarketSecondsBetween1D(t *testing.T) {
|
||||||
|
assert := assert.New(t)
|
||||||
|
|
||||||
|
start := time.Date(2016, 07, 22, 9, 45, 0, 0, Date.Eastern())
|
||||||
|
end := time.Date(2016, 07, 22, 15, 45, 0, 0, Date.Eastern())
|
||||||
|
|
||||||
|
shouldbe := 6 * 60 * 60
|
||||||
|
|
||||||
|
assert.Equal(shouldbe, Date.CalculateMarketSecondsBetween(start, end, NYSEOpen(), NYSEClose(), Date.IsNYSEHoliday))
|
||||||
|
}
|
||||||
|
|
||||||
|
func TestCalculateMarketSecondsBetweenLTM(t *testing.T) {
|
||||||
|
assert := assert.New(t)
|
||||||
|
|
||||||
|
start := time.Date(2015, 07, 01, 9, 30, 0, 0, Date.Eastern())
|
||||||
|
end := time.Date(2016, 07, 01, 9, 30, 0, 0, Date.Eastern())
|
||||||
|
|
||||||
|
shouldbe := 253 * 6.5 * 60 * 60 //253 full market days since this date last year.
|
||||||
|
assert.Equal(shouldbe, Date.CalculateMarketSecondsBetween(start, end, NYSEOpen(), NYSEClose(), Date.IsNYSEHoliday))
|
||||||
|
}
|
||||||
|
|
||||||
|
func TestDateNextHour(t *testing.T) {
|
||||||
|
assert := assert.New(t)
|
||||||
|
|
||||||
|
start := time.Date(2015, 07, 01, 9, 30, 0, 0, Date.Eastern())
|
||||||
|
next := Date.NextHour(start)
|
||||||
|
assert.Equal(2015, next.Year())
|
||||||
|
assert.Equal(07, next.Month())
|
||||||
|
assert.Equal(01, next.Day())
|
||||||
|
assert.Equal(10, next.Hour())
|
||||||
|
assert.Equal(00, next.Minute())
|
||||||
|
|
||||||
|
next = Date.NextHour(next)
|
||||||
|
assert.Equal(11, next.Hour())
|
||||||
|
|
||||||
|
next = Date.NextHour(next)
|
||||||
|
assert.Equal(12, next.Hour())
|
||||||
|
|
||||||
|
}
|
||||||
|
|
||||||
|
func TestDateNextDayOfWeek(t *testing.T) {
|
||||||
|
assert := assert.New(t)
|
||||||
|
|
||||||
|
weds := Date.Date(2016, 8, 10, time.UTC)
|
||||||
|
fri := Date.Date(2016, 8, 12, time.UTC)
|
||||||
|
sun := Date.Date(2016, 8, 14, time.UTC)
|
||||||
|
mon := Date.Date(2016, 8, 15, time.UTC)
|
||||||
|
weds2 := Date.Date(2016, 8, 17, time.UTC)
|
||||||
|
|
||||||
|
nextFri := Date.NextDayOfWeek(weds, time.Friday)
|
||||||
|
nextSunday := Date.NextDayOfWeek(weds, time.Sunday)
|
||||||
|
nextMonday := Date.NextDayOfWeek(weds, time.Monday)
|
||||||
|
nextWeds := Date.NextDayOfWeek(weds, time.Wednesday)
|
||||||
|
|
||||||
|
assert.Equal(fri.Year(), nextFri.Year())
|
||||||
|
assert.Equal(fri.Month(), nextFri.Month())
|
||||||
|
assert.Equal(fri.Day(), nextFri.Day())
|
||||||
|
|
||||||
|
assert.Equal(sun.Year(), nextSunday.Year())
|
||||||
|
assert.Equal(sun.Month(), nextSunday.Month())
|
||||||
|
assert.Equal(sun.Day(), nextSunday.Day())
|
||||||
|
|
||||||
|
assert.Equal(mon.Year(), nextMonday.Year())
|
||||||
|
assert.Equal(mon.Month(), nextMonday.Month())
|
||||||
|
assert.Equal(mon.Day(), nextMonday.Day())
|
||||||
|
|
||||||
|
assert.Equal(weds2.Year(), nextWeds.Year())
|
||||||
|
assert.Equal(weds2.Month(), nextWeds.Month())
|
||||||
|
assert.Equal(weds2.Day(), nextWeds.Day())
|
||||||
|
|
||||||
|
assert.Equal(time.UTC, nextFri.Location())
|
||||||
|
assert.Equal(time.UTC, nextSunday.Location())
|
||||||
|
assert.Equal(time.UTC, nextMonday.Location())
|
||||||
|
}
|
||||||
|
|
||||||
|
func TestDateIsNYSEHoliday(t *testing.T) {
|
||||||
|
assert := assert.New(t)
|
||||||
|
|
||||||
|
cursor := time.Date(2013, 01, 01, 0, 0, 0, 0, time.UTC)
|
||||||
|
end := time.Date(2020, 1, 1, 0, 0, 0, 0, time.UTC)
|
||||||
|
var holidays int
|
||||||
|
for Date.Before(cursor, end) {
|
||||||
|
if Date.IsNYSEHoliday(cursor) {
|
||||||
|
holidays++
|
||||||
|
}
|
||||||
|
cursor = cursor.AddDate(0, 0, 1)
|
||||||
|
}
|
||||||
|
assert.Equal(holidays, 55)
|
||||||
|
}
|
||||||
|
|
||||||
|
func TestTimeStart(t *testing.T) {
|
||||||
|
assert := assert.New(t)
|
||||||
|
|
||||||
|
times := []time.Time{
|
||||||
|
time.Now().AddDate(0, 0, -4),
|
||||||
|
time.Now().AddDate(0, 0, -2),
|
||||||
|
time.Now().AddDate(0, 0, -1),
|
||||||
|
time.Now().AddDate(0, 0, -3),
|
||||||
|
time.Now().AddDate(0, 0, -5),
|
||||||
|
}
|
||||||
|
|
||||||
|
assert.InTimeDelta(Date.Start(times), times[4], time.Millisecond)
|
||||||
|
}
|
||||||
|
|
||||||
|
func TestTimeEnd(t *testing.T) {
|
||||||
|
assert := assert.New(t)
|
||||||
|
|
||||||
|
times := []time.Time{
|
||||||
|
time.Now().AddDate(0, 0, -4),
|
||||||
|
time.Now().AddDate(0, 0, -2),
|
||||||
|
time.Now().AddDate(0, 0, -1),
|
||||||
|
time.Now().AddDate(0, 0, -3),
|
||||||
|
time.Now().AddDate(0, 0, -5),
|
||||||
|
}
|
||||||
|
|
||||||
|
assert.InTimeDelta(Date.End(times), times[2], time.Millisecond)
|
||||||
|
}
|
||||||
|
|
||||||
|
func TestDateDiffDays(t *testing.T) {
|
||||||
|
assert := assert.New(t)
|
||||||
|
|
||||||
|
t1 := time.Date(2017, 02, 27, 12, 0, 0, 0, time.UTC)
|
||||||
|
t2 := time.Date(2017, 01, 10, 3, 0, 0, 0, time.UTC)
|
||||||
|
t3 := time.Date(2017, 02, 24, 16, 0, 0, 0, time.UTC)
|
||||||
|
|
||||||
|
assert.Equal(48, Date.DiffDays(t2, t1))
|
||||||
|
assert.Equal(2, Date.DiffDays(t3, t1)) // technically we should round down.
|
||||||
|
}
|
||||||
|
|
||||||
|
func TestDateDiffHours(t *testing.T) {
|
||||||
|
assert := assert.New(t)
|
||||||
|
|
||||||
|
t1 := time.Date(2017, 02, 27, 12, 0, 0, 0, time.UTC)
|
||||||
|
t2 := time.Date(2017, 02, 24, 16, 0, 0, 0, time.UTC)
|
||||||
|
t3 := time.Date(2017, 02, 28, 12, 0, 0, 0, time.UTC)
|
||||||
|
|
||||||
|
assert.Equal(68, Date.DiffHours(t2, t1))
|
||||||
|
assert.Equal(24, Date.DiffHours(t1, t3))
|
||||||
|
}
|
||||||
17
date_windows.go
Normal file
|
|
@ -0,0 +1,17 @@
|
||||||
|
// +build windows
|
||||||
|
|
||||||
|
package chart
|
||||||
|
|
||||||
|
import "time"
|
||||||
|
|
||||||
|
// Eastern returns the eastern timezone.
|
||||||
|
func (d date) Eastern() *time.Location {
|
||||||
|
if _eastern == nil {
|
||||||
|
_easternLock.Lock()
|
||||||
|
defer _easternLock.Unlock()
|
||||||
|
if _eastern == nil {
|
||||||
|
_eastern, _ = time.LoadLocation("EST")
|
||||||
|
}
|
||||||
|
}
|
||||||
|
return _eastern
|
||||||
|
}
|
||||||
142
defaults.go
|
|
@ -1,5 +1,12 @@
|
||||||
package chart
|
package chart
|
||||||
|
|
||||||
|
import (
|
||||||
|
"sync"
|
||||||
|
|
||||||
|
"github.com/golang/freetype/truetype"
|
||||||
|
"github.com/wcharczuk/go-chart/drawing"
|
||||||
|
)
|
||||||
|
|
||||||
const (
|
const (
|
||||||
// DefaultChartHeight is the default chart height.
|
// DefaultChartHeight is the default chart height.
|
||||||
DefaultChartHeight = 400
|
DefaultChartHeight = 400
|
||||||
|
|
@ -75,6 +82,96 @@ const (
|
||||||
DefaultBarWidth = 50
|
DefaultBarWidth = 50
|
||||||
)
|
)
|
||||||
|
|
||||||
|
var (
|
||||||
|
// ColorWhite is white.
|
||||||
|
ColorWhite = drawing.Color{R: 255, G: 255, B: 255, A: 255}
|
||||||
|
// ColorBlue is the basic theme blue color.
|
||||||
|
ColorBlue = drawing.Color{R: 0, G: 116, B: 217, A: 255}
|
||||||
|
// ColorCyan is the basic theme cyan color.
|
||||||
|
ColorCyan = drawing.Color{R: 0, G: 217, B: 210, A: 255}
|
||||||
|
// ColorGreen is the basic theme green color.
|
||||||
|
ColorGreen = drawing.Color{R: 0, G: 217, B: 101, A: 255}
|
||||||
|
// ColorRed is the basic theme red color.
|
||||||
|
ColorRed = drawing.Color{R: 217, G: 0, B: 116, A: 255}
|
||||||
|
// ColorOrange is the basic theme orange color.
|
||||||
|
ColorOrange = drawing.Color{R: 217, G: 101, B: 0, A: 255}
|
||||||
|
// ColorYellow is the basic theme yellow color.
|
||||||
|
ColorYellow = drawing.Color{R: 217, G: 210, B: 0, A: 255}
|
||||||
|
// ColorBlack is the basic theme black color.
|
||||||
|
ColorBlack = drawing.Color{R: 51, G: 51, B: 51, A: 255}
|
||||||
|
// ColorLightGray is the basic theme light gray color.
|
||||||
|
ColorLightGray = drawing.Color{R: 239, G: 239, B: 239, A: 255}
|
||||||
|
|
||||||
|
// ColorAlternateBlue is a alternate theme color.
|
||||||
|
ColorAlternateBlue = drawing.Color{R: 106, G: 195, B: 203, A: 255}
|
||||||
|
// ColorAlternateGreen is a alternate theme color.
|
||||||
|
ColorAlternateGreen = drawing.Color{R: 42, G: 190, B: 137, A: 255}
|
||||||
|
// ColorAlternateGray is a alternate theme color.
|
||||||
|
ColorAlternateGray = drawing.Color{R: 110, G: 128, B: 139, A: 255}
|
||||||
|
// ColorAlternateYellow is a alternate theme color.
|
||||||
|
ColorAlternateYellow = drawing.Color{R: 240, G: 174, B: 90, A: 255}
|
||||||
|
// ColorAlternateLightGray is a alternate theme color.
|
||||||
|
ColorAlternateLightGray = drawing.Color{R: 187, G: 190, B: 191, A: 255}
|
||||||
|
|
||||||
|
// ColorTransparent is a transparent (alpha zero) color.
|
||||||
|
ColorTransparent = drawing.Color{R: 1, G: 1, B: 1, A: 0}
|
||||||
|
)
|
||||||
|
|
||||||
|
var (
|
||||||
|
// DefaultBackgroundColor is the default chart background color.
|
||||||
|
// It is equivalent to css color:white.
|
||||||
|
DefaultBackgroundColor = ColorWhite
|
||||||
|
// DefaultBackgroundStrokeColor is the default chart border color.
|
||||||
|
// It is equivalent to color:white.
|
||||||
|
DefaultBackgroundStrokeColor = ColorWhite
|
||||||
|
// DefaultCanvasColor is the default chart canvas color.
|
||||||
|
// It is equivalent to css color:white.
|
||||||
|
DefaultCanvasColor = ColorWhite
|
||||||
|
// DefaultCanvasStrokeColor is the default chart canvas stroke color.
|
||||||
|
// It is equivalent to css color:white.
|
||||||
|
DefaultCanvasStrokeColor = ColorWhite
|
||||||
|
// DefaultTextColor is the default chart text color.
|
||||||
|
// It is equivalent to #333333.
|
||||||
|
DefaultTextColor = ColorBlack
|
||||||
|
// DefaultAxisColor is the default chart axis line color.
|
||||||
|
// It is equivalent to #333333.
|
||||||
|
DefaultAxisColor = ColorBlack
|
||||||
|
// DefaultStrokeColor is the default chart border color.
|
||||||
|
// It is equivalent to #efefef.
|
||||||
|
DefaultStrokeColor = ColorLightGray
|
||||||
|
// DefaultFillColor is the default fill color.
|
||||||
|
// It is equivalent to #0074d9.
|
||||||
|
DefaultFillColor = ColorBlue
|
||||||
|
// DefaultAnnotationFillColor is the default annotation background color.
|
||||||
|
DefaultAnnotationFillColor = ColorWhite
|
||||||
|
// DefaultGridLineColor is the default grid line color.
|
||||||
|
DefaultGridLineColor = ColorLightGray
|
||||||
|
)
|
||||||
|
|
||||||
|
var (
|
||||||
|
// DefaultColors are a couple default series colors.
|
||||||
|
DefaultColors = []drawing.Color{
|
||||||
|
ColorBlue,
|
||||||
|
ColorGreen,
|
||||||
|
ColorRed,
|
||||||
|
ColorCyan,
|
||||||
|
ColorOrange,
|
||||||
|
}
|
||||||
|
|
||||||
|
// DefaultAlternateColors are a couple alternate colors.
|
||||||
|
DefaultAlternateColors = []drawing.Color{
|
||||||
|
ColorAlternateBlue,
|
||||||
|
ColorAlternateGreen,
|
||||||
|
ColorAlternateGray,
|
||||||
|
ColorAlternateYellow,
|
||||||
|
ColorBlue,
|
||||||
|
ColorGreen,
|
||||||
|
ColorRed,
|
||||||
|
ColorCyan,
|
||||||
|
ColorOrange,
|
||||||
|
}
|
||||||
|
)
|
||||||
|
|
||||||
var (
|
var (
|
||||||
// DashArrayDots is a dash array that represents '....' style stroke dashes.
|
// DashArrayDots is a dash array that represents '....' style stroke dashes.
|
||||||
DashArrayDots = []int{1, 1}
|
DashArrayDots = []int{1, 1}
|
||||||
|
|
@ -86,18 +183,49 @@ var (
|
||||||
DashArrayDashesLarge = []int{10, 10}
|
DashArrayDashesLarge = []int{10, 10}
|
||||||
)
|
)
|
||||||
|
|
||||||
|
// NewColor returns a new color.
|
||||||
|
func NewColor(r, g, b, a uint8) drawing.Color {
|
||||||
|
return drawing.Color{R: r, G: g, B: b, A: a}
|
||||||
|
}
|
||||||
|
|
||||||
|
// GetDefaultColor returns a color from the default list by index.
|
||||||
|
// NOTE: the index will wrap around (using a modulo).
|
||||||
|
func GetDefaultColor(index int) drawing.Color {
|
||||||
|
finalIndex := index % len(DefaultColors)
|
||||||
|
return DefaultColors[finalIndex]
|
||||||
|
}
|
||||||
|
|
||||||
|
// GetAlternateColor returns a color from the default list by index.
|
||||||
|
// NOTE: the index will wrap around (using a modulo).
|
||||||
|
func GetAlternateColor(index int) drawing.Color {
|
||||||
|
finalIndex := index % len(DefaultAlternateColors)
|
||||||
|
return DefaultAlternateColors[finalIndex]
|
||||||
|
}
|
||||||
|
|
||||||
var (
|
var (
|
||||||
// DefaultAnnotationPadding is the padding around an annotation.
|
// DefaultAnnotationPadding is the padding around an annotation.
|
||||||
DefaultAnnotationPadding = Box{Top: 5, Left: 5, Right: 5, Bottom: 5}
|
DefaultAnnotationPadding = Box{Top: 5, Left: 5, Right: 5, Bottom: 5}
|
||||||
|
|
||||||
// DefaultBackgroundPadding is the default canvas padding config.
|
// DefaultBackgroundPadding is the default canvas padding config.
|
||||||
DefaultBackgroundPadding = Box{Top: 5, Left: 5, Right: 5, Bottom: 5}
|
DefaultBackgroundPadding = Box{Top: 5, Left: 5, Right: 5, Bottom: 5}
|
||||||
)
|
)
|
||||||
|
|
||||||
const (
|
var (
|
||||||
// ContentTypePNG is the png mime type.
|
_defaultFontLock sync.Mutex
|
||||||
ContentTypePNG = "image/png"
|
_defaultFont *truetype.Font
|
||||||
|
|
||||||
// ContentTypeSVG is the svg mime type.
|
|
||||||
ContentTypeSVG = "image/svg+xml"
|
|
||||||
)
|
)
|
||||||
|
|
||||||
|
// GetDefaultFont returns the default font (Roboto-Medium).
|
||||||
|
func GetDefaultFont() (*truetype.Font, error) {
|
||||||
|
if _defaultFont == nil {
|
||||||
|
_defaultFontLock.Lock()
|
||||||
|
defer _defaultFontLock.Unlock()
|
||||||
|
if _defaultFont == nil {
|
||||||
|
font, err := truetype.Parse(roboto)
|
||||||
|
if err != nil {
|
||||||
|
return nil, err
|
||||||
|
}
|
||||||
|
_defaultFont = font
|
||||||
|
}
|
||||||
|
}
|
||||||
|
return _defaultFont, nil
|
||||||
|
}
|
||||||
|
|
|
||||||
47
draw.go
|
|
@ -1,10 +1,6 @@
|
||||||
package chart
|
package chart
|
||||||
|
|
||||||
import (
|
import "math"
|
||||||
"math"
|
|
||||||
|
|
||||||
util "git.fireandbrimst.one/aw/go-chart/util"
|
|
||||||
)
|
|
||||||
|
|
||||||
var (
|
var (
|
||||||
// Draw contains helpers for drawing common objects.
|
// Draw contains helpers for drawing common objects.
|
||||||
|
|
@ -14,7 +10,7 @@ var (
|
||||||
type draw struct{}
|
type draw struct{}
|
||||||
|
|
||||||
// LineSeries draws a line series with a renderer.
|
// LineSeries draws a line series with a renderer.
|
||||||
func (d draw) LineSeries(r Renderer, canvasBox Box, xrange, yrange Range, style Style, vs ValuesProvider) {
|
func (d draw) LineSeries(r Renderer, canvasBox Box, xrange, yrange Range, style Style, vs ValueProvider) {
|
||||||
if vs.Len() == 0 {
|
if vs.Len() == 0 {
|
||||||
return
|
return
|
||||||
}
|
}
|
||||||
|
|
@ -22,7 +18,7 @@ func (d draw) LineSeries(r Renderer, canvasBox Box, xrange, yrange Range, style
|
||||||
cb := canvasBox.Bottom
|
cb := canvasBox.Bottom
|
||||||
cl := canvasBox.Left
|
cl := canvasBox.Left
|
||||||
|
|
||||||
v0x, v0y := vs.GetValues(0)
|
v0x, v0y := vs.GetValue(0)
|
||||||
x0 := cl + xrange.Translate(v0x)
|
x0 := cl + xrange.Translate(v0x)
|
||||||
y0 := cb - yrange.Translate(v0y)
|
y0 := cb - yrange.Translate(v0y)
|
||||||
|
|
||||||
|
|
@ -35,13 +31,13 @@ func (d draw) LineSeries(r Renderer, canvasBox Box, xrange, yrange Range, style
|
||||||
style.GetFillOptions().WriteDrawingOptionsToRenderer(r)
|
style.GetFillOptions().WriteDrawingOptionsToRenderer(r)
|
||||||
r.MoveTo(x0, y0)
|
r.MoveTo(x0, y0)
|
||||||
for i := 1; i < vs.Len(); i++ {
|
for i := 1; i < vs.Len(); i++ {
|
||||||
vx, vy = vs.GetValues(i)
|
vx, vy = vs.GetValue(i)
|
||||||
x = cl + xrange.Translate(vx)
|
x = cl + xrange.Translate(vx)
|
||||||
y = cb - yrange.Translate(vy)
|
y = cb - yrange.Translate(vy)
|
||||||
r.LineTo(x, y)
|
r.LineTo(x, y)
|
||||||
}
|
}
|
||||||
r.LineTo(x, util.Math.MinInt(cb, cb-yv0))
|
r.LineTo(x, Math.MinInt(cb, cb-yv0))
|
||||||
r.LineTo(x0, util.Math.MinInt(cb, cb-yv0))
|
r.LineTo(x0, Math.MinInt(cb, cb-yv0))
|
||||||
r.LineTo(x0, y0)
|
r.LineTo(x0, y0)
|
||||||
r.Fill()
|
r.Fill()
|
||||||
}
|
}
|
||||||
|
|
@ -51,7 +47,7 @@ func (d draw) LineSeries(r Renderer, canvasBox Box, xrange, yrange Range, style
|
||||||
|
|
||||||
r.MoveTo(x0, y0)
|
r.MoveTo(x0, y0)
|
||||||
for i := 1; i < vs.Len(); i++ {
|
for i := 1; i < vs.Len(); i++ {
|
||||||
vx, vy = vs.GetValues(i)
|
vx, vy = vs.GetValue(i)
|
||||||
x = cl + xrange.Translate(vx)
|
x = cl + xrange.Translate(vx)
|
||||||
y = cb - yrange.Translate(vy)
|
y = cb - yrange.Translate(vy)
|
||||||
r.LineTo(x, y)
|
r.LineTo(x, y)
|
||||||
|
|
@ -60,34 +56,23 @@ func (d draw) LineSeries(r Renderer, canvasBox Box, xrange, yrange Range, style
|
||||||
}
|
}
|
||||||
|
|
||||||
if style.ShouldDrawDot() {
|
if style.ShouldDrawDot() {
|
||||||
defaultDotWidth := style.GetDotWidth()
|
dotWidth := style.GetDotWidth()
|
||||||
|
|
||||||
style.GetDotOptions().WriteDrawingOptionsToRenderer(r)
|
style.GetDotOptions().WriteDrawingOptionsToRenderer(r)
|
||||||
|
|
||||||
for i := 0; i < vs.Len(); i++ {
|
for i := 0; i < vs.Len(); i++ {
|
||||||
vx, vy = vs.GetValues(i)
|
vx, vy = vs.GetValue(i)
|
||||||
x = cl + xrange.Translate(vx)
|
x = cl + xrange.Translate(vx)
|
||||||
y = cb - yrange.Translate(vy)
|
y = cb - yrange.Translate(vy)
|
||||||
|
|
||||||
dotWidth := defaultDotWidth
|
|
||||||
if style.DotWidthProvider != nil {
|
|
||||||
dotWidth = style.DotWidthProvider(xrange, yrange, i, vx, vy)
|
|
||||||
}
|
|
||||||
|
|
||||||
if style.DotColorProvider != nil {
|
|
||||||
dotColor := style.DotColorProvider(xrange, yrange, i, vx, vy)
|
|
||||||
|
|
||||||
r.SetFillColor(dotColor)
|
|
||||||
r.SetStrokeColor(dotColor)
|
|
||||||
}
|
|
||||||
|
|
||||||
r.Circle(dotWidth, x, y)
|
r.Circle(dotWidth, x, y)
|
||||||
r.FillStroke()
|
r.FillStroke()
|
||||||
}
|
}
|
||||||
}
|
}
|
||||||
}
|
}
|
||||||
|
|
||||||
// BoundedSeries draws a series that implements BoundedValuesProvider.
|
// BoundedSeries draws a series that implements BoundedValueProvider.
|
||||||
func (d draw) BoundedSeries(r Renderer, canvasBox Box, xrange, yrange Range, style Style, bbs BoundedValuesProvider, drawOffsetIndexes ...int) {
|
func (d draw) BoundedSeries(r Renderer, canvasBox Box, xrange, yrange Range, style Style, bbs BoundedValueProvider, drawOffsetIndexes ...int) {
|
||||||
drawOffsetIndex := 0
|
drawOffsetIndex := 0
|
||||||
if len(drawOffsetIndexes) > 0 {
|
if len(drawOffsetIndexes) > 0 {
|
||||||
drawOffsetIndex = drawOffsetIndexes[0]
|
drawOffsetIndex = drawOffsetIndexes[0]
|
||||||
|
|
@ -96,7 +81,7 @@ func (d draw) BoundedSeries(r Renderer, canvasBox Box, xrange, yrange Range, sty
|
||||||
cb := canvasBox.Bottom
|
cb := canvasBox.Bottom
|
||||||
cl := canvasBox.Left
|
cl := canvasBox.Left
|
||||||
|
|
||||||
v0x, v0y1, v0y2 := bbs.GetBoundedValues(0)
|
v0x, v0y1, v0y2 := bbs.GetBoundedValue(0)
|
||||||
x0 := cl + xrange.Translate(v0x)
|
x0 := cl + xrange.Translate(v0x)
|
||||||
y0 := cb - yrange.Translate(v0y1)
|
y0 := cb - yrange.Translate(v0y1)
|
||||||
|
|
||||||
|
|
@ -111,7 +96,7 @@ func (d draw) BoundedSeries(r Renderer, canvasBox Box, xrange, yrange Range, sty
|
||||||
style.GetFillAndStrokeOptions().WriteToRenderer(r)
|
style.GetFillAndStrokeOptions().WriteToRenderer(r)
|
||||||
r.MoveTo(x0, y0)
|
r.MoveTo(x0, y0)
|
||||||
for i := 1; i < bbs.Len(); i++ {
|
for i := 1; i < bbs.Len(); i++ {
|
||||||
vx, vy1, vy2 = bbs.GetBoundedValues(i)
|
vx, vy1, vy2 = bbs.GetBoundedValue(i)
|
||||||
|
|
||||||
xvalues[i] = vx
|
xvalues[i] = vx
|
||||||
y2values[i] = vy2
|
y2values[i] = vy2
|
||||||
|
|
@ -137,7 +122,7 @@ func (d draw) BoundedSeries(r Renderer, canvasBox Box, xrange, yrange Range, sty
|
||||||
}
|
}
|
||||||
|
|
||||||
// HistogramSeries draws a value provider as boxes from 0.
|
// HistogramSeries draws a value provider as boxes from 0.
|
||||||
func (d draw) HistogramSeries(r Renderer, canvasBox Box, xrange, yrange Range, style Style, vs ValuesProvider, barWidths ...int) {
|
func (d draw) HistogramSeries(r Renderer, canvasBox Box, xrange, yrange Range, style Style, vs ValueProvider, barWidths ...int) {
|
||||||
if vs.Len() == 0 {
|
if vs.Len() == 0 {
|
||||||
return
|
return
|
||||||
}
|
}
|
||||||
|
|
@ -154,7 +139,7 @@ func (d draw) HistogramSeries(r Renderer, canvasBox Box, xrange, yrange Range, s
|
||||||
|
|
||||||
//foreach datapoint, draw a box.
|
//foreach datapoint, draw a box.
|
||||||
for index := 0; index < seriesLength; index++ {
|
for index := 0; index < seriesLength; index++ {
|
||||||
vx, vy := vs.GetValues(index)
|
vx, vy := vs.GetValue(index)
|
||||||
y0 := yrange.Translate(0)
|
y0 := yrange.Translate(0)
|
||||||
x := cl + xrange.Translate(vx)
|
x := cl + xrange.Translate(vx)
|
||||||
y := yrange.Translate(vy)
|
y := yrange.Translate(vy)
|
||||||
|
|
|
||||||
|
|
@ -57,11 +57,6 @@ func ColorFromAlphaMixedRGBA(r, g, b, a uint32) Color {
|
||||||
return c
|
return c
|
||||||
}
|
}
|
||||||
|
|
||||||
// ColorChannelFromFloat returns a normalized byte from a given float value.
|
|
||||||
func ColorChannelFromFloat(v float64) uint8 {
|
|
||||||
return uint8(v * 255)
|
|
||||||
}
|
|
||||||
|
|
||||||
// Color is our internal color type because color.Color is bullshit.
|
// Color is our internal color type because color.Color is bullshit.
|
||||||
type Color struct {
|
type Color struct {
|
||||||
R, G, B, A uint8
|
R, G, B, A uint8
|
||||||
|
|
|
||||||
53
drawing/color_test.go
Normal file
|
|
@ -0,0 +1,53 @@
|
||||||
|
package drawing
|
||||||
|
|
||||||
|
import (
|
||||||
|
"testing"
|
||||||
|
|
||||||
|
"image/color"
|
||||||
|
|
||||||
|
"github.com/blendlabs/go-assert"
|
||||||
|
)
|
||||||
|
|
||||||
|
func TestColorFromHex(t *testing.T) {
|
||||||
|
assert := assert.New(t)
|
||||||
|
|
||||||
|
white := ColorFromHex("FFFFFF")
|
||||||
|
assert.Equal(ColorWhite, white)
|
||||||
|
|
||||||
|
shortWhite := ColorFromHex("FFF")
|
||||||
|
assert.Equal(ColorWhite, shortWhite)
|
||||||
|
|
||||||
|
black := ColorFromHex("000000")
|
||||||
|
assert.Equal(ColorBlack, black)
|
||||||
|
|
||||||
|
shortBlack := ColorFromHex("000")
|
||||||
|
assert.Equal(ColorBlack, shortBlack)
|
||||||
|
|
||||||
|
red := ColorFromHex("FF0000")
|
||||||
|
assert.Equal(ColorRed, red)
|
||||||
|
|
||||||
|
shortRed := ColorFromHex("F00")
|
||||||
|
assert.Equal(ColorRed, shortRed)
|
||||||
|
|
||||||
|
green := ColorFromHex("00FF00")
|
||||||
|
assert.Equal(ColorGreen, green)
|
||||||
|
|
||||||
|
shortGreen := ColorFromHex("0F0")
|
||||||
|
assert.Equal(ColorGreen, shortGreen)
|
||||||
|
|
||||||
|
blue := ColorFromHex("0000FF")
|
||||||
|
assert.Equal(ColorBlue, blue)
|
||||||
|
|
||||||
|
shortBlue := ColorFromHex("00F")
|
||||||
|
assert.Equal(ColorBlue, shortBlue)
|
||||||
|
}
|
||||||
|
|
||||||
|
func TestColorFromAlphaMixedRGBA(t *testing.T) {
|
||||||
|
assert := assert.New(t)
|
||||||
|
|
||||||
|
black := ColorFromAlphaMixedRGBA(color.Black.RGBA())
|
||||||
|
assert.True(black.Equals(ColorBlack), black.String())
|
||||||
|
|
||||||
|
white := ColorFromAlphaMixedRGBA(color.White.RGBA())
|
||||||
|
assert.True(white.Equals(ColorWhite), white.String())
|
||||||
|
}
|
||||||
35
drawing/curve_test.go
Normal file
|
|
@ -0,0 +1,35 @@
|
||||||
|
package drawing
|
||||||
|
|
||||||
|
import (
|
||||||
|
"testing"
|
||||||
|
|
||||||
|
assert "github.com/blendlabs/go-assert"
|
||||||
|
)
|
||||||
|
|
||||||
|
type point struct {
|
||||||
|
X, Y float64
|
||||||
|
}
|
||||||
|
|
||||||
|
type mockLine struct {
|
||||||
|
inner []point
|
||||||
|
}
|
||||||
|
|
||||||
|
func (ml *mockLine) LineTo(x, y float64) {
|
||||||
|
ml.inner = append(ml.inner, point{x, y})
|
||||||
|
}
|
||||||
|
|
||||||
|
func (ml mockLine) Len() int {
|
||||||
|
return len(ml.inner)
|
||||||
|
}
|
||||||
|
|
||||||
|
func TestTraceQuad(t *testing.T) {
|
||||||
|
assert := assert.New(t)
|
||||||
|
|
||||||
|
// Quad
|
||||||
|
// x1, y1, cpx1, cpy2, x2, y2 float64
|
||||||
|
// do the 9->12 circle segment
|
||||||
|
quad := []float64{10, 20, 20, 20, 20, 10}
|
||||||
|
liner := &mockLine{}
|
||||||
|
TraceQuad(liner, quad, 0.5)
|
||||||
|
assert.NotZero(liner.Len())
|
||||||
|
}
|
||||||
|
|
@ -3,7 +3,7 @@ package drawing
|
||||||
import (
|
import (
|
||||||
"image/color"
|
"image/color"
|
||||||
|
|
||||||
"git.fireandbrimst.one/aw/golang-freetype/truetype"
|
"github.com/golang/freetype/truetype"
|
||||||
)
|
)
|
||||||
|
|
||||||
// FillRule defines the type for fill rules
|
// FillRule defines the type for fill rules
|
||||||
|
|
|
||||||
|
|
@ -1,8 +1,8 @@
|
||||||
package drawing
|
package drawing
|
||||||
|
|
||||||
import (
|
import (
|
||||||
"git.fireandbrimst.one/aw/golang-freetype/raster"
|
"github.com/golang/freetype/raster"
|
||||||
"git.fireandbrimst.one/aw/golang-image/math/fixed"
|
"golang.org/x/image/math/fixed"
|
||||||
)
|
)
|
||||||
|
|
||||||
// FtLineBuilder is a builder for freetype raster glyphs.
|
// FtLineBuilder is a builder for freetype raster glyphs.
|
||||||
|
|
|
||||||
|
|
@ -4,7 +4,7 @@ import (
|
||||||
"image"
|
"image"
|
||||||
"image/color"
|
"image/color"
|
||||||
|
|
||||||
"git.fireandbrimst.one/aw/golang-freetype/truetype"
|
"github.com/golang/freetype/truetype"
|
||||||
)
|
)
|
||||||
|
|
||||||
// GraphicContext describes the interface for the various backends (images, pdf, opengl, ...)
|
// GraphicContext describes the interface for the various backends (images, pdf, opengl, ...)
|
||||||
|
|
|
||||||
|
|
@ -4,10 +4,10 @@ import (
|
||||||
"image"
|
"image"
|
||||||
"image/color"
|
"image/color"
|
||||||
|
|
||||||
"git.fireandbrimst.one/aw/golang-image/draw"
|
"golang.org/x/image/draw"
|
||||||
"git.fireandbrimst.one/aw/golang-image/math/f64"
|
"golang.org/x/image/math/f64"
|
||||||
|
|
||||||
"git.fireandbrimst.one/aw/golang-freetype/raster"
|
"github.com/golang/freetype/raster"
|
||||||
)
|
)
|
||||||
|
|
||||||
// Painter implements the freetype raster.Painter and has a SetColor method like the RGBAPainter
|
// Painter implements the freetype raster.Painter and has a SetColor method like the RGBAPainter
|
||||||
|
|
|
||||||
|
|
@ -6,11 +6,11 @@ import (
|
||||||
"image/color"
|
"image/color"
|
||||||
"math"
|
"math"
|
||||||
|
|
||||||
"git.fireandbrimst.one/aw/golang-freetype/raster"
|
"github.com/golang/freetype/raster"
|
||||||
"git.fireandbrimst.one/aw/golang-freetype/truetype"
|
"github.com/golang/freetype/truetype"
|
||||||
"git.fireandbrimst.one/aw/golang-image/draw"
|
"golang.org/x/image/draw"
|
||||||
"git.fireandbrimst.one/aw/golang-image/font"
|
"golang.org/x/image/font"
|
||||||
"git.fireandbrimst.one/aw/golang-image/math/fixed"
|
"golang.org/x/image/math/fixed"
|
||||||
)
|
)
|
||||||
|
|
||||||
// NewRasterGraphicContext creates a new Graphic context from an image.
|
// NewRasterGraphicContext creates a new Graphic context from an image.
|
||||||
|
|
@ -206,7 +206,7 @@ func (rgc *RasterGraphicContext) GetFont() *truetype.Font {
|
||||||
return rgc.current.Font
|
return rgc.current.Font
|
||||||
}
|
}
|
||||||
|
|
||||||
// SetFontSize sets the font size in points (as in “a 12 point font”).
|
// SetFontSize sets the font size in points (as in ``a 12 point font'').
|
||||||
func (rgc *RasterGraphicContext) SetFontSize(fontSizePoints float64) {
|
func (rgc *RasterGraphicContext) SetFontSize(fontSizePoints float64) {
|
||||||
rgc.current.FontSizePoints = fontSizePoints
|
rgc.current.FontSizePoints = fontSizePoints
|
||||||
rgc.recalc()
|
rgc.recalc()
|
||||||
|
|
|
||||||
|
|
@ -4,7 +4,7 @@ import (
|
||||||
"image"
|
"image"
|
||||||
"image/color"
|
"image/color"
|
||||||
|
|
||||||
"git.fireandbrimst.one/aw/golang-freetype/truetype"
|
"github.com/golang/freetype/truetype"
|
||||||
)
|
)
|
||||||
|
|
||||||
// StackGraphicContext is a context that does thngs.
|
// StackGraphicContext is a context that does thngs.
|
||||||
|
|
|
||||||
|
|
@ -1,8 +1,8 @@
|
||||||
package drawing
|
package drawing
|
||||||
|
|
||||||
import (
|
import (
|
||||||
"git.fireandbrimst.one/aw/golang-freetype/truetype"
|
"github.com/golang/freetype/truetype"
|
||||||
"git.fireandbrimst.one/aw/golang-image/math/fixed"
|
"golang.org/x/image/math/fixed"
|
||||||
)
|
)
|
||||||
|
|
||||||
// DrawContour draws the given closed contour at the given sub-pixel offset.
|
// DrawContour draws the given closed contour at the given sub-pixel offset.
|
||||||
|
|
|
||||||
|
|
@ -3,10 +3,10 @@ package drawing
|
||||||
import (
|
import (
|
||||||
"math"
|
"math"
|
||||||
|
|
||||||
"git.fireandbrimst.one/aw/golang-image/math/fixed"
|
"golang.org/x/image/math/fixed"
|
||||||
|
|
||||||
"git.fireandbrimst.one/aw/golang-freetype/raster"
|
"github.com/golang/freetype/raster"
|
||||||
"git.fireandbrimst.one/aw/golang-freetype/truetype"
|
"github.com/golang/freetype/truetype"
|
||||||
)
|
)
|
||||||
|
|
||||||
// PixelsToPoints returns the points for a given number of pixels at a DPI.
|
// PixelsToPoints returns the points for a given number of pixels at a DPI.
|
||||||
|
|
|
||||||
|
|
@ -7,13 +7,6 @@ const (
|
||||||
DefaultEMAPeriod = 12
|
DefaultEMAPeriod = 12
|
||||||
)
|
)
|
||||||
|
|
||||||
// Interface Assertions.
|
|
||||||
var (
|
|
||||||
_ Series = (*EMASeries)(nil)
|
|
||||||
_ FirstValuesProvider = (*EMASeries)(nil)
|
|
||||||
_ LastValuesProvider = (*EMASeries)(nil)
|
|
||||||
)
|
|
||||||
|
|
||||||
// EMASeries is a computed series.
|
// EMASeries is a computed series.
|
||||||
type EMASeries struct {
|
type EMASeries struct {
|
||||||
Name string
|
Name string
|
||||||
|
|
@ -21,7 +14,7 @@ type EMASeries struct {
|
||||||
YAxis YAxisType
|
YAxis YAxisType
|
||||||
|
|
||||||
Period int
|
Period int
|
||||||
InnerSeries ValuesProvider
|
InnerSeries ValueProvider
|
||||||
|
|
||||||
cache []float64
|
cache []float64
|
||||||
}
|
}
|
||||||
|
|
@ -59,36 +52,23 @@ func (ema EMASeries) GetSigma() float64 {
|
||||||
return 2.0 / (float64(ema.GetPeriod()) + 1)
|
return 2.0 / (float64(ema.GetPeriod()) + 1)
|
||||||
}
|
}
|
||||||
|
|
||||||
// GetValues gets a value at a given index.
|
// GetValue gets a value at a given index.
|
||||||
func (ema *EMASeries) GetValues(index int) (x, y float64) {
|
func (ema *EMASeries) GetValue(index int) (x, y float64) {
|
||||||
if ema.InnerSeries == nil {
|
if ema.InnerSeries == nil {
|
||||||
return
|
return
|
||||||
}
|
}
|
||||||
if len(ema.cache) == 0 {
|
if len(ema.cache) == 0 {
|
||||||
ema.ensureCachedValues()
|
ema.ensureCachedValues()
|
||||||
}
|
}
|
||||||
vx, _ := ema.InnerSeries.GetValues(index)
|
vx, _ := ema.InnerSeries.GetValue(index)
|
||||||
x = vx
|
x = vx
|
||||||
y = ema.cache[index]
|
y = ema.cache[index]
|
||||||
return
|
return
|
||||||
}
|
}
|
||||||
|
|
||||||
// GetFirstValues computes the first moving average value.
|
// GetLastValue computes the last moving average value but walking back window size samples,
|
||||||
func (ema *EMASeries) GetFirstValues() (x, y float64) {
|
|
||||||
if ema.InnerSeries == nil {
|
|
||||||
return
|
|
||||||
}
|
|
||||||
if len(ema.cache) == 0 {
|
|
||||||
ema.ensureCachedValues()
|
|
||||||
}
|
|
||||||
x, _ = ema.InnerSeries.GetValues(0)
|
|
||||||
y = ema.cache[0]
|
|
||||||
return
|
|
||||||
}
|
|
||||||
|
|
||||||
// GetLastValues computes the last moving average value but walking back window size samples,
|
|
||||||
// and recomputing the last moving average chunk.
|
// and recomputing the last moving average chunk.
|
||||||
func (ema *EMASeries) GetLastValues() (x, y float64) {
|
func (ema *EMASeries) GetLastValue() (x, y float64) {
|
||||||
if ema.InnerSeries == nil {
|
if ema.InnerSeries == nil {
|
||||||
return
|
return
|
||||||
}
|
}
|
||||||
|
|
@ -96,7 +76,7 @@ func (ema *EMASeries) GetLastValues() (x, y float64) {
|
||||||
ema.ensureCachedValues()
|
ema.ensureCachedValues()
|
||||||
}
|
}
|
||||||
lastIndex := ema.InnerSeries.Len() - 1
|
lastIndex := ema.InnerSeries.Len() - 1
|
||||||
x, _ = ema.InnerSeries.GetValues(lastIndex)
|
x, _ = ema.InnerSeries.GetValue(lastIndex)
|
||||||
y = ema.cache[lastIndex]
|
y = ema.cache[lastIndex]
|
||||||
return
|
return
|
||||||
}
|
}
|
||||||
|
|
@ -106,7 +86,7 @@ func (ema *EMASeries) ensureCachedValues() {
|
||||||
ema.cache = make([]float64, seriesLength)
|
ema.cache = make([]float64, seriesLength)
|
||||||
sigma := ema.GetSigma()
|
sigma := ema.GetSigma()
|
||||||
for x := 0; x < seriesLength; x++ {
|
for x := 0; x < seriesLength; x++ {
|
||||||
_, y := ema.InnerSeries.GetValues(x)
|
_, y := ema.InnerSeries.GetValue(x)
|
||||||
if x == 0 {
|
if x == 0 {
|
||||||
ema.cache[x] = y
|
ema.cache[x] = y
|
||||||
continue
|
continue
|
||||||
|
|
|
||||||
105
ema_series_test.go
Normal file
|
|
@ -0,0 +1,105 @@
|
||||||
|
package chart
|
||||||
|
|
||||||
|
import (
|
||||||
|
"testing"
|
||||||
|
|
||||||
|
"github.com/blendlabs/go-assert"
|
||||||
|
)
|
||||||
|
|
||||||
|
var (
|
||||||
|
emaXValues = Sequence.Float64(1.0, 50.0)
|
||||||
|
emaYValues = []float64{
|
||||||
|
1, 2, 3, 4, 5, 4, 3, 2,
|
||||||
|
1, 2, 3, 4, 5, 4, 3, 2,
|
||||||
|
1, 2, 3, 4, 5, 4, 3, 2,
|
||||||
|
1, 2, 3, 4, 5, 4, 3, 2,
|
||||||
|
1, 2, 3, 4, 5, 4, 3, 2,
|
||||||
|
1, 2, 3, 4, 5, 4, 3, 2,
|
||||||
|
1, 2,
|
||||||
|
}
|
||||||
|
emaExpected = []float64{
|
||||||
|
1,
|
||||||
|
1.074074074,
|
||||||
|
1.216735254,
|
||||||
|
1.422903013,
|
||||||
|
1.68787316,
|
||||||
|
1.859141815,
|
||||||
|
1.943649828,
|
||||||
|
1.947823915,
|
||||||
|
1.877614736,
|
||||||
|
1.886680311,
|
||||||
|
1.969148437,
|
||||||
|
2.119581886,
|
||||||
|
2.33294619,
|
||||||
|
2.456431658,
|
||||||
|
2.496695979,
|
||||||
|
2.459903685,
|
||||||
|
2.351762671,
|
||||||
|
2.325706177,
|
||||||
|
2.375653867,
|
||||||
|
2.495975803,
|
||||||
|
2.681459077,
|
||||||
|
2.779128775,
|
||||||
|
2.795489607,
|
||||||
|
2.73656445,
|
||||||
|
2.607930047,
|
||||||
|
2.562898191,
|
||||||
|
2.595276103,
|
||||||
|
2.699329725,
|
||||||
|
2.869749746,
|
||||||
|
2.953471987,
|
||||||
|
2.956918506,
|
||||||
|
2.886035654,
|
||||||
|
2.746329309,
|
||||||
|
2.691045657,
|
||||||
|
2.713931163,
|
||||||
|
2.809195522,
|
||||||
|
2.971477335,
|
||||||
|
3.047664199,
|
||||||
|
3.044133518,
|
||||||
|
2.966790294,
|
||||||
|
2.821102124,
|
||||||
|
2.760279745,
|
||||||
|
2.778036801,
|
||||||
|
2.868552593,
|
||||||
|
3.026437586,
|
||||||
|
3.098553321,
|
||||||
|
3.091253075,
|
||||||
|
3.010419514,
|
||||||
|
2.86149955,
|
||||||
|
2.797684768,
|
||||||
|
}
|
||||||
|
emaDelta = 0.0001
|
||||||
|
)
|
||||||
|
|
||||||
|
func TestEMASeries(t *testing.T) {
|
||||||
|
assert := assert.New(t)
|
||||||
|
|
||||||
|
mockSeries := mockValueProvider{
|
||||||
|
emaXValues,
|
||||||
|
emaYValues,
|
||||||
|
}
|
||||||
|
assert.Equal(50, mockSeries.Len())
|
||||||
|
|
||||||
|
ema := &EMASeries{
|
||||||
|
InnerSeries: mockSeries,
|
||||||
|
Period: 26,
|
||||||
|
}
|
||||||
|
|
||||||
|
sig := ema.GetSigma()
|
||||||
|
assert.Equal(2.0/(26.0+1), sig)
|
||||||
|
|
||||||
|
var yvalues []float64
|
||||||
|
for x := 0; x < ema.Len(); x++ {
|
||||||
|
_, y := ema.GetValue(x)
|
||||||
|
yvalues = append(yvalues, y)
|
||||||
|
}
|
||||||
|
|
||||||
|
for index, yv := range yvalues {
|
||||||
|
assert.InDelta(yv, emaExpected[index], emaDelta)
|
||||||
|
}
|
||||||
|
|
||||||
|
lvx, lvy := ema.GetLastValue()
|
||||||
|
assert.Equal(50.0, lvx)
|
||||||
|
assert.InDelta(lvy, emaExpected[49], emaDelta)
|
||||||
|
}
|
||||||
|
|
@ -1,4 +1,4 @@
|
||||||
package util
|
package chart
|
||||||
|
|
||||||
import (
|
import (
|
||||||
"bufio"
|
"bufio"
|
||||||
|
|
@ -14,30 +14,24 @@ var (
|
||||||
type fileUtil struct{}
|
type fileUtil struct{}
|
||||||
|
|
||||||
// ReadByLines reads a file and calls the handler for each line.
|
// ReadByLines reads a file and calls the handler for each line.
|
||||||
func (fu fileUtil) ReadByLines(filePath string, handler func(line string) error) error {
|
func (fu fileUtil) ReadByLines(filePath string, handler func(line string)) error {
|
||||||
var f *os.File
|
if f, err := os.Open(filePath); err == nil {
|
||||||
var err error
|
|
||||||
if f, err = os.Open(filePath); err == nil {
|
|
||||||
defer f.Close()
|
defer f.Close()
|
||||||
var line string
|
|
||||||
scanner := bufio.NewScanner(f)
|
scanner := bufio.NewScanner(f)
|
||||||
for scanner.Scan() {
|
for scanner.Scan() {
|
||||||
line = scanner.Text()
|
line := scanner.Text()
|
||||||
err = handler(line)
|
handler(line)
|
||||||
if err != nil {
|
|
||||||
return err
|
|
||||||
}
|
|
||||||
}
|
}
|
||||||
|
} else {
|
||||||
|
return err
|
||||||
}
|
}
|
||||||
return err
|
return nil
|
||||||
|
|
||||||
}
|
}
|
||||||
|
|
||||||
// ReadByChunks reads a file in `chunkSize` pieces, dispatched to the handler.
|
// ReadByChunks reads a file in `chunkSize` pieces, dispatched to the handler.
|
||||||
func (fu fileUtil) ReadByChunks(filePath string, chunkSize int, handler func(line []byte) error) error {
|
func (fu fileUtil) ReadByChunks(filePath string, chunkSize int, handler func(line []byte)) error {
|
||||||
var f *os.File
|
if f, err := os.Open(filePath); err == nil {
|
||||||
var err error
|
|
||||||
if f, err = os.Open(filePath); err == nil {
|
|
||||||
defer f.Close()
|
defer f.Close()
|
||||||
|
|
||||||
chunk := make([]byte, chunkSize)
|
chunk := make([]byte, chunkSize)
|
||||||
|
|
@ -47,11 +41,10 @@ func (fu fileUtil) ReadByChunks(filePath string, chunkSize int, handler func(lin
|
||||||
break
|
break
|
||||||
}
|
}
|
||||||
readData := chunk[:readBytes]
|
readData := chunk[:readBytes]
|
||||||
err = handler(readData)
|
handler(readData)
|
||||||
if err != nil {
|
|
||||||
return err
|
|
||||||
}
|
|
||||||
}
|
}
|
||||||
|
} else {
|
||||||
|
return err
|
||||||
}
|
}
|
||||||
return err
|
return nil
|
||||||
}
|
}
|
||||||
|
|
@ -1,37 +0,0 @@
|
||||||
package chart
|
|
||||||
|
|
||||||
import "fmt"
|
|
||||||
|
|
||||||
// FirstValueAnnotation returns an annotation series of just the first value of a value provider as an annotation.
|
|
||||||
func FirstValueAnnotation(innerSeries ValuesProvider, vfs ...ValueFormatter) AnnotationSeries {
|
|
||||||
var vf ValueFormatter
|
|
||||||
if len(vfs) > 0 {
|
|
||||||
vf = vfs[0]
|
|
||||||
} else if typed, isTyped := innerSeries.(ValueFormatterProvider); isTyped {
|
|
||||||
_, vf = typed.GetValueFormatters()
|
|
||||||
} else {
|
|
||||||
vf = FloatValueFormatter
|
|
||||||
}
|
|
||||||
|
|
||||||
var firstValue Value2
|
|
||||||
if typed, isTyped := innerSeries.(FirstValuesProvider); isTyped {
|
|
||||||
firstValue.XValue, firstValue.YValue = typed.GetFirstValues()
|
|
||||||
firstValue.Label = vf(firstValue.YValue)
|
|
||||||
} else {
|
|
||||||
firstValue.XValue, firstValue.YValue = innerSeries.GetValues(0)
|
|
||||||
firstValue.Label = vf(firstValue.YValue)
|
|
||||||
}
|
|
||||||
|
|
||||||
var seriesName string
|
|
||||||
var seriesStyle Style
|
|
||||||
if typed, isTyped := innerSeries.(Series); isTyped {
|
|
||||||
seriesName = fmt.Sprintf("%s - First Value", typed.GetName())
|
|
||||||
seriesStyle = typed.GetStyle()
|
|
||||||
}
|
|
||||||
|
|
||||||
return AnnotationSeries{
|
|
||||||
Name: seriesName,
|
|
||||||
Style: seriesStyle,
|
|
||||||
Annotations: []Value2{firstValue},
|
|
||||||
}
|
|
||||||
}
|
|
||||||
29
font.go
|
|
@ -1,29 +0,0 @@
|
||||||
package chart
|
|
||||||
|
|
||||||
import (
|
|
||||||
"sync"
|
|
||||||
|
|
||||||
"git.fireandbrimst.one/aw/go-chart/roboto"
|
|
||||||
"git.fireandbrimst.one/aw/golang-freetype/truetype"
|
|
||||||
)
|
|
||||||
|
|
||||||
var (
|
|
||||||
_defaultFontLock sync.Mutex
|
|
||||||
_defaultFont *truetype.Font
|
|
||||||
)
|
|
||||||
|
|
||||||
// GetDefaultFont returns the default font (Roboto-Medium).
|
|
||||||
func GetDefaultFont() (*truetype.Font, error) {
|
|
||||||
if _defaultFont == nil {
|
|
||||||
_defaultFontLock.Lock()
|
|
||||||
defer _defaultFontLock.Unlock()
|
|
||||||
if _defaultFont == nil {
|
|
||||||
font, err := truetype.Parse(roboto.Roboto)
|
|
||||||
if err != nil {
|
|
||||||
return nil, err
|
|
||||||
}
|
|
||||||
_defaultFont = font
|
|
||||||
}
|
|
||||||
}
|
|
||||||
return _defaultFont, nil
|
|
||||||
}
|
|
||||||
24
grid_line_test.go
Normal file
|
|
@ -0,0 +1,24 @@
|
||||||
|
package chart
|
||||||
|
|
||||||
|
import (
|
||||||
|
"testing"
|
||||||
|
|
||||||
|
"github.com/blendlabs/go-assert"
|
||||||
|
)
|
||||||
|
|
||||||
|
func TestGenerateGridLines(t *testing.T) {
|
||||||
|
assert := assert.New(t)
|
||||||
|
|
||||||
|
ticks := []Tick{
|
||||||
|
{Value: 1.0, Label: "1.0"},
|
||||||
|
{Value: 2.0, Label: "2.0"},
|
||||||
|
{Value: 3.0, Label: "3.0"},
|
||||||
|
{Value: 4.0, Label: "4.0"},
|
||||||
|
}
|
||||||
|
|
||||||
|
gl := GenerateGridLines(ticks, Style{}, Style{})
|
||||||
|
assert.Len(gl, 2)
|
||||||
|
|
||||||
|
assert.Equal(2.0, gl[0].Value)
|
||||||
|
assert.Equal(3.0, gl[1].Value)
|
||||||
|
}
|
||||||